Research Article |
|
Corresponding author: Hassan Y. Aboul-Enein ( haboulenein@yahoo.com ) Academic editor: Plamen Peikov
© 2022 Andrei A. Bunaciu, Serban Fleschin, Hassan Y. Aboul-Enein.
This is an open access article distributed under the terms of the Creative Commons Attribution License (CC BY 4.0), which permits unrestricted use, distribution, and reproduction in any medium, provided the original author and source are credited.
Citation:
Bunaciu AA, Fleschin S, Aboul-Enein HY (2022) Determination of some edible oils adulteration with paraffin oil using infrared spectroscopy. Pharmacia 69(3): 827-832. https://doi.org/10.3897/pharmacia.69.e76175
|
Abstract
The spectroscopy of molecular vibrations using mid-infrared or near-infrared techniques was used more and more to characterize different compounds, including edible oil, in order to monitor any changes and to detect fraudulent modifications. This article presents a new method for quantitative adulteration of extra virgin olive oil (EVOO) or corn germ oil (CGO) with a mineral oil, such as paraffin oil (PO). A Fourier transform infrared (FT-IR) spectrometric method, using ATR spectra, was developed for the rapid, direct measurement of edible oils adulteration. The results indicate the efficiency of the proposed method for the detection of paraffin oil in adulteration of EVOO and CGO with RSD (< 3.0%).
Graphical abstract:
Keywords
FT-IR analysis, mineral oil, olive and corn germ, oil adulteration analysis, Beer’s law
Introduction
The term “edible oils” (also possibly referred to as “cooking oils”) describes a group of fatty liquids physically extracted from several vegetables, some animal tissues or microorganisms (
Vegetable oils are some of the most important and used agricultural products worldwide, existing a great variety of oils that can contribute to the human diet. Edible oils and fats are known to be essential nutritional requirements for humans. An adult needs approximately 5 g daily of linolenic and unsaturated fatty acids, which cannot be manufactured within the body (
Extra-virgin olive oil (EVOO) is a well-known vegetable oil extracted from fruits only by using physical and mechanical processes (
Corn germ oil (CGO) is a by-product of the corn oil milling process. Most corn that is harvested is used as feed but the proportion of the corn that is milled is increasing due to the bioethanol production (
Mineral oils (such as paraffinum liquidum or white oil, PO), which consist of mineral oil saturated hydrocarbons (MOSH) and mineral oil aromatic hydrocarbons (MOAH), are widely applied in various consumer products such as medicines and cosmetics.
Adulteration represents an unhealthy and unethical act of adding prohibited substances to food with a profit motive. In these conditions it is necessary to ensure the authenticity of the food that we consume has intensified more and more in the last period of time all over the world. Usually, low priced oils are mixed with premium oils. Many analytical techniques, such as: chromatographic methods, differential scanning calorimetry, Fourier transform infrared spectroscopy, etc. can be used to discriminate different oils as well as to detect adulteration (
The main purpose of this work was to develop a spectrophotometric procedure for the fast and accurate determination of two types of extra-virgin olive oil (EVOO) and corn germ oil (CGO) adulterated with paraffin oil (PO) in commercial products using Lambert-Beer’s law reducing in this way the sample pretreatment, and providing direct FTIR measurement.
Experimental
Apparatus
Data acquisition was performed using a Spectrum1000 FT-IR spectrometer equipped with Spectrum for Windows v.5.01 (Perkin Elmer Co., Beaconsfield, Bucks, UK). The commercial softwares used to generate analysis for the principal component analysis were QUANT+ expert v.4.51 and Spectrum Beer’s law v.10.7.2.1360 (Perkin Elmer Co. UK).
Reagents and materials
The commercial products, two types of EVOO (Extra Virgin Olive Oil – Costa d’Oro, Italy and respectively Extravirgin Olive Oil – Primadonna, Italy, both blend of Olive from European Union origin and not of European Union origin), a type of CGO (Italy, obtained exclusively by physical means, pressing without the use of solvents) and a type of PO (Vitalia Pharma Ploiesti district – Romania), were acquired from Romanian commercial stores. All solvents (hexane and acetone) were reagent grade and were obtained from Aldrich Chemical Co. (Milwaukee, WI).
Recommended procedures
All samples were homogenized and a small amount of sample was spread onto the ATR crystal to give total coverage. For each sample, the absorbance spectrum was collected against a background obtained with a dry and empty ATR cell, before each day of measurements. The spectra were scanned in triplicate at room temperature over the wavenumber interval of 4000–650 cm-1, averaging 16 scans at a resolution of 4 cm-1 or 8 cm-1, and then were averaged before calculations. After acquiring each spectrum, the ATR crystal was cleaned with a cellulose tissue soaked in hexane and then rinsed with acetone.
Experimental parameters, such as resolutions and calibration methods were compared and recommendations for the best options in edible oils analysis were made.
Stock solutions for paraffin oil with the appropriate concentration (C, %) in edible oils, in order to cover the range of detection 1, 2, 3, 4, 5, 6, 7, 8, 9, 10, 20, 30, 40. 50, 60, 70, 80, 90 and 100% (v/v) with EVOO 1, EVOO 2 and CGO, respectively, were prepared.
Results and discussions
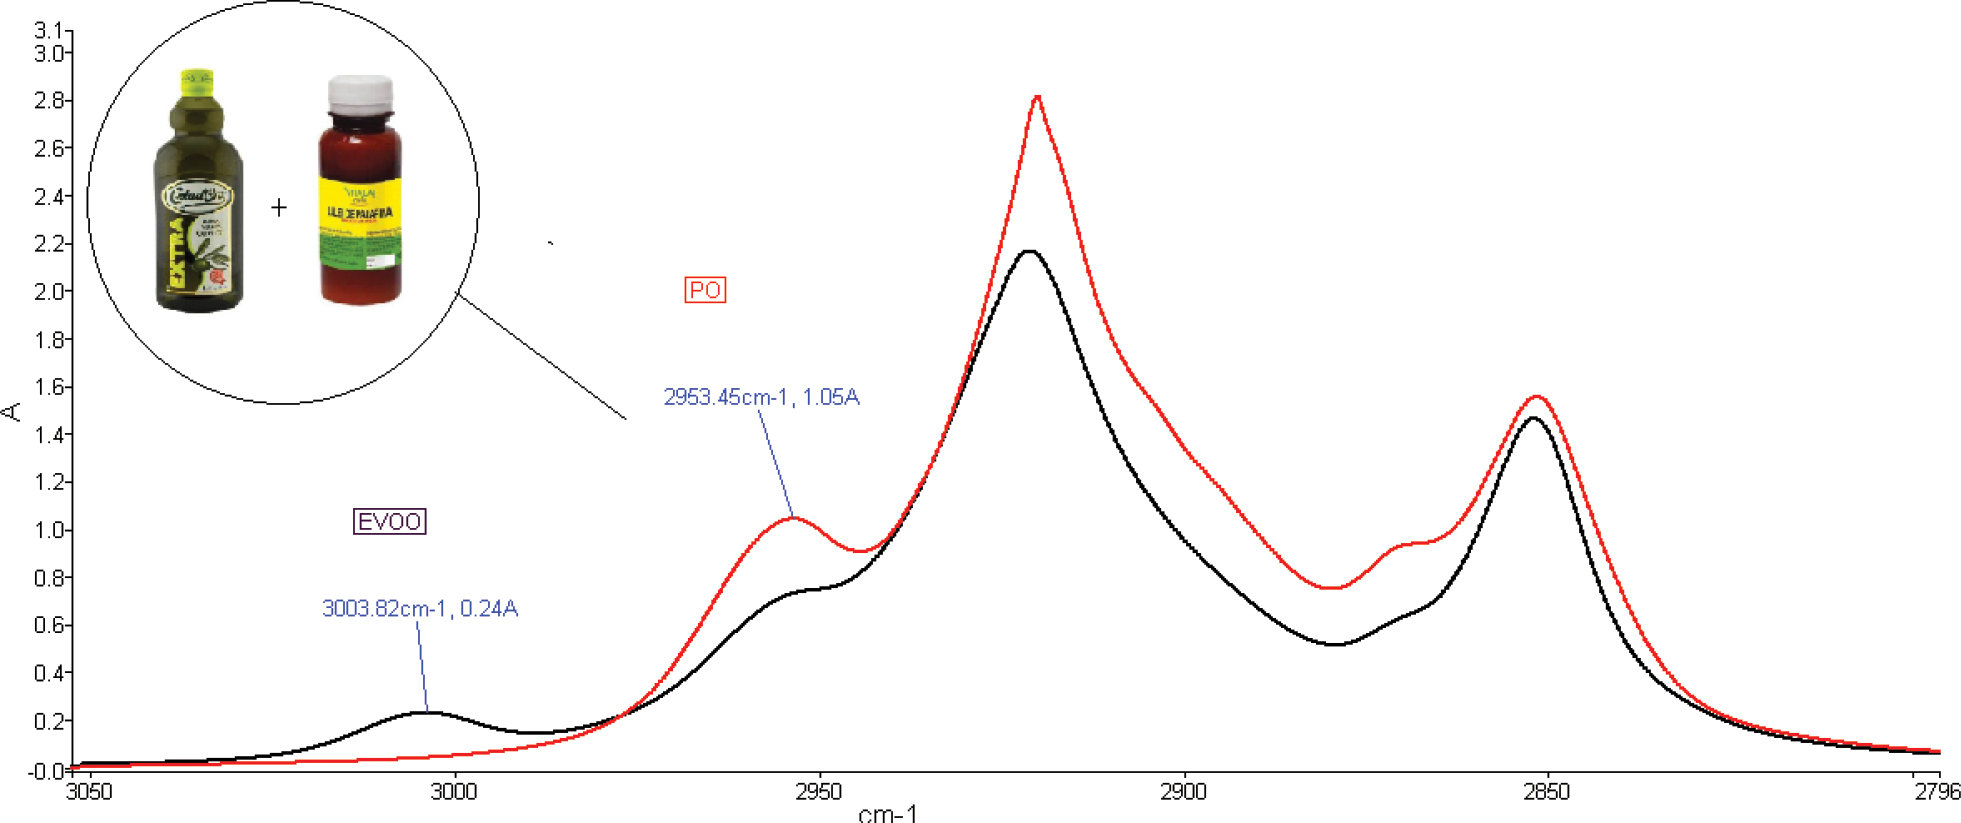
Figure

As can be noticed from this figure, there are no significant differences between the spectra of EVOO 1, EVOO 2 and CGO. The single major difference is the position of the peak assigned to cis double bond observed at about 3003 cm-1, in the spectrum of EVOO1, EVOO2 and respectively 3007 cm-1 for CGO samples. In the spectrum of PO, the characteristic peak assigned to methyl asymmetrical stretching vibration, observed at 2953 cm-1, it was used for quantitative determination, as can be seen, en details, in Fig.


Taking into account the small differences between the FTIR spectra of edible oils and the mineral one, we tried to develop a new spectrophotometric method for quantitative determination of adulteration of edible oils with the mineral oil.
Using the standards prepared by us, noticed in Recommended procedures, we obtained calibration curves for quantitative determination of the adulteration.
In Fig.


As can be observed, the calibration graph can be divided into two linear domains, where slopes change depending on the concentration: one for the adulteration with 1–10%, and the other one in the range of 10–100% adulteration, each of them being characterized by specific linear equations.
Similar results were obtained for the binary mixtures of EVOO and PO.
In Table
| Parameter | Binary mixtures | |||
|---|---|---|---|---|
| EVOO – PO | CGO – PO | |||
| Range % (v/v) | ||||
| 0–10 PO | 10–100 PO | 0–10 PO | 10–100 PO | |
| Slope | -0.001 | -0.018 | -0.023 | -0.228 |
| Intercept | 0.232 | 0.234 | 2.313 | 2.278 |
| Correlation coefficient | 0.998 | 0.997 | 0.998 | 0.999 |
For the quantitative determinations of edible oils adulteration with mineral oil (paraffin oil), were used both variants. The results presented in Tables
Quantitative determination of extravirgin olive oil adulteration with paraffin oil.
| Taken (%) | Found at 1743.60 cm-1 | Found at 2956.45 cm-1 | ||
|---|---|---|---|---|
| (%) | RSD, % | (%) | RSD, % | |
| 3.5 | 3.53 | 0.32 | 3.44 | 0.88 |
| 15.0 | 14.90 | 0.24 | 15.08 | 1.15 |
| 25.0 | 25.24 | 0.48 | 25.34 | 1.78 |
The limit of quantification (LOQ) was determined by the analysis of samples with known concentration of PO and by establishing the minimum level at which the analyte can be quantified with acceptable accuracy and precision, 3% v/v PO. The limit of detection (LOD), 1% v/v, was considered as the signal to noise ratio of 3:1 (
Quantitative determination of corn germ oil adulteration with paraffin oil.
| Taken (%) | Found at 1743.26 cm-1 | Found at 2956.45 cm-1 | ||
|---|---|---|---|---|
| (%) | RSD (%) | (%) | RSD | |
| 3.5 | 3.49 | 0.33 | 3.57 | 0.70 |
| 15.0 | 15.36 | 0.27 | 15.58 | 1.06 |
| 25.0 | 25.12 | 0.59 | 25.56 | 1.42 |
As can be seen in these Tables, the results are very similar, and so, we suggest the use of this method, especially for the determination of the major component of the mixture, EVOO or CGO, because of the smaller value of RSD (< 1.0%). Also, for the determination of paraffin oil quantity, the results are also good, even the RSD value is a little higher.
Conclusions
It is clear that FT-IR spectrometry is capable of direct determination of EVOO and CGO in several mixtures when adulterated with a mineral oil, PO. With the commercial software involving Beer-Lambert law, the method proposed is simple, precise and not time-consuming compared to chromatographic methods. Quantification could be done in about 5–10 minutes, including sample preparation and spectral acquisition.
Conflict of interest
Andrei A. Bunaciu declares that he has no conflict of interest. Serban Fleschin declares that he has no conflict of interest. Hassan Y. Aboul-Enein declares that he has no conflict of interest.
Ethical approval
This article does not contain any studies with human participants or animals performed by any of the authors.
References
- Bunaciu AA, Aboul-Enein HY, Hoang VD (2020) Chapter 7 – Edible oil analysis. In: Bunaciu AA, Aboul-Enein HY, VD Hoang (Eds) Vibrational Spectroscopy Application in Biomedical, Pharmaceutical and Food Sciences. Elsevier Inc., 167–187. https://doi.org/10.1016/B978-0-12-818827-9.00009-3
- Council Regulation (EC) No 1513/2001 (2001) Amending Regulations No 136/66/EEC and (EC) No 1638/98 as regards the extension of the period of validity of the aid scheme and the quality strategy for olive oil. Official Journal of the European Communities 201: 4–7.
- Dijkstra AJ (2016) Vegetable Oils: Types and Properties. In: Caballero B, Finglas P, Toldra F (Eds) Encyclopedia of Food and Health. Elsevier, Academic press, 381–386. https://doi.org/10.1016/B978-0-12-384947-2.00706-6
- Gómez-Caravaca AM, Maggio RM, Cerretani L (2016) Chemometric applications to assess quality and critical parameters of Virgin and Extra-Virgin Olive Oil. A review. Analytica Chimica Acta 913: 1–21. https://doi.org/10.1016/j.aca.2016.01.025
- Guillén MD, Cabo N (1997) Characterization of Edible Oils and Lard by Fourier Transform Infrared Spectroscopy. Relationships Between Composition and Frequency of Concrete Bands in the Fingerprint Region. Journal of the American Oil Chemists’ Society 74: 1281–1286. https://doi.org/10.1007/s11746-997-0058-4
- Issaoui M, Delgado AM (2019) Grading, Labeling and Standardization of Edible Oils. In: Ramadan MF (Ed.) Fruit Oils: Chemistry and Functionality. Springer Nature Switzerland AG, 9–52. https://doi.org/10.1007/978-3-030-12473-1_2
- Jamwal R, Amit S, Kumari S, Sharma S, Kelly S, Cannavan A, Singh DK (2021) Recent trends in the use of FTIR spectroscopy integrated with chemometrics for the detection of edible oil adulteration. Vibrational Spectroscopy 113: e103222. https://doi.org/10.1016/j.vibspec.2021.103222
- Kettner C, Kettner D, Field D, Sansone S-A, Taylor C, Aerts J, Binns N, Blake A, Britten CM, de Marco A, Fostel J, Gaudet P, González-Beltrán A, Hardy N, Hellemans J, Hermjakob H, Juty N, Leebens-Mack J, Maguire E, Neumann S, Orchard S, Parkinson H, Piel W, Ranganathan S, Rocca-Serra P, Santarsiero A, Shotton D, Sterk P, Untergasser A, Whetzel PL (2015) Meeting report from the second ‘‘Minimum information for biological and biomedical investigations’’(MIBBI) workshop. Standards in Genomic Sciences 3: 259–265. https://doi.org/10.4056/sigs.147362
- Libish TM, Linesh J, Bobby MC, Biswas P, Bandyopadhyay S, Dasgupta K, Radhakrishnan P (2011) Detection and analysis of paraffin oil adulteration in coconut oil using fiber optic long period grating sensor. Optik 122: 1939–1942. https://doi.org/10.1016/j.ijleo.2010.12.009
- Meenu M, Cai Q, Xu B (2019) A critical review on analytical techniques to detect adulteration of extra virgin olive oil. Trends in Food Science & Technology 91: 391–408. https://doi.org/10.1016/j.tifs.2019.07.045
- Moldovan Z, Popa DE, David IG, Buleandra M, Badea IA (2017) A Derivative Spectrometric Method for Hydroquinone Determination in the Presence of Kojic Acid, Glycolic Acid, and Ascorbic Acid. Journal of Spectroscopy 2017: 1–9. https://doi.org/10.1155/2017/6929520
- Oliveri P, Downey G (2012) Multivariate class modeling for the verification of food-authenticity claims. Trends in Analytical Chemistry 35: 74–86. https://doi.org/10.1016/j.trac.2012.02.005
- Pitts M, Dorling D, Pattie C (2007) Oil for food: the global story of edible lipids. Journal of World-Systems Research 13: 12–32. https://doi.org/10.5195/jwsr.2007.358
- QianWen Du, MengTing Zhu, Ting Shi, Xiang Luo, Bei Gan, Li Jun Tang , Yi Chen (2020) Adulteration detection of corn oil, rapeseed oil and sunflower oil in camellia oil by in situ diffuse reflectance near-infrared spectroscopy and chemometrics. Food Control 121: e107577. https://doi.org/10.1016/j.foodcont.2020.107577
- Rohman A (2017) The use of infrared spectroscopy in combination with chemometrics for quality control and authentication of edible fats and oils: A review. Applied Spectroscopy Reviews 52(7): 589–604. https://doi.org/10.1080/05704928.2016.1266493
- Rohman A, Al’Ikhsan M, Ghazali B, Windarsih A, Irnawati Riyanto S, Yusof FM, Mustafa S (2020) Comprehensive Review on Application of FTIR Spectroscopy Coupled with Chemometrics for Authentication Analysis of Fats and Oils in the Food Products. Molecules 25: e5485. https://doi.org/10.3390/molecules25225485
- Shrivastava A, Gupta V (2011) Methods for the determination of limit of detection and limit of quantitation of the analytical methods. Chronicles of Young Scientists 2(1): 21–25. https://doi.org/10.4103/2229-5186.79345
- Spink J, Moyer DC (2011) Defining the public health threat of food fraud. Journal of Food Science 76(9): R157–R163. https://doi.org/10.1111/j.1750-3841.2011.02417.x
- Valand R, Tanna S, Lawson G, Bengtström L (2019) A review of Fourier Transform Infrared (FTIR) spectroscopy used in food adulteration and authenticity investigations. Food Additives & Contaminants: Part A 37(16): 1–20. https://doi.org/10.1080/19440049.2019.1675909
- Vasconcelos M, Coelho L, Barros A, de Almei JMMM (2015) Study of adulteration of extra virgin olive oil with peanut oil using FTIR spectroscopy and chemometrics. Cogent Food & Agriculture 1: e1018695. https://doi.org/10.1080/23311932.2015.1018695
- Weber S, Schrag K, Mildau G, Kuballa T, Walch SG, Lachenmeier DW (2018) Analytical Methods for the Determination of Mineral Oil Saturated Hydrocarbons (MOSH) and Mineral Oil Aromatic Hydrocarbons (MOAH)–A Short Review. Analytical Chemistry Insights 13: 1–16. https://doi.org/10.1177/1177390118777757