Research Article |
|
Corresponding author: Angel T. Alvarado ( eaa.alvarado@hotmail.com ) Academic editor: Rumiana Simeonova
© 2024 Angel T. Alvarado, Haydee Chávez, Jorge A. García, María R. Bendezú, Felipe Surco-Laos, Aura Molina-Cabrera, Doris Laos-Anchante, Nelly Vega-Ramos, Juan J. Palomino-Jhong, Paulina Eliades Yarasca-Carlos, Berta Loja-Herrera, Mario Pineda-Pérez, Mario Bolarte-Arteaga.
This is an open access article distributed under the terms of the Creative Commons Attribution License (CC BY 4.0), which permits unrestricted use, distribution, and reproduction in any medium, provided the original author and source are credited.
Citation:
Alvarado AT, Chávez H, García JA, Bendezú MR, Surco-Laos F, Molina-Cabrera A, Laos-Anchante D, Vega-Ramos N, Palomino-Jhong JJ, Yarasca-Carlos PE, Loja-Herrera B, Pineda-Pérez M, Bolarte-Arteaga M (2024) Biophenolic compounds and metal ions associated with the antioxidant and antibacterial activity of the ethanolic extract of Heliotropium arborescens L. leaves from the Andean region of Ayacucho-Peru. Pharmacia 71: 1-12. https://doi.org/10.3897/pharmacia.71.e120315
|
Abstract
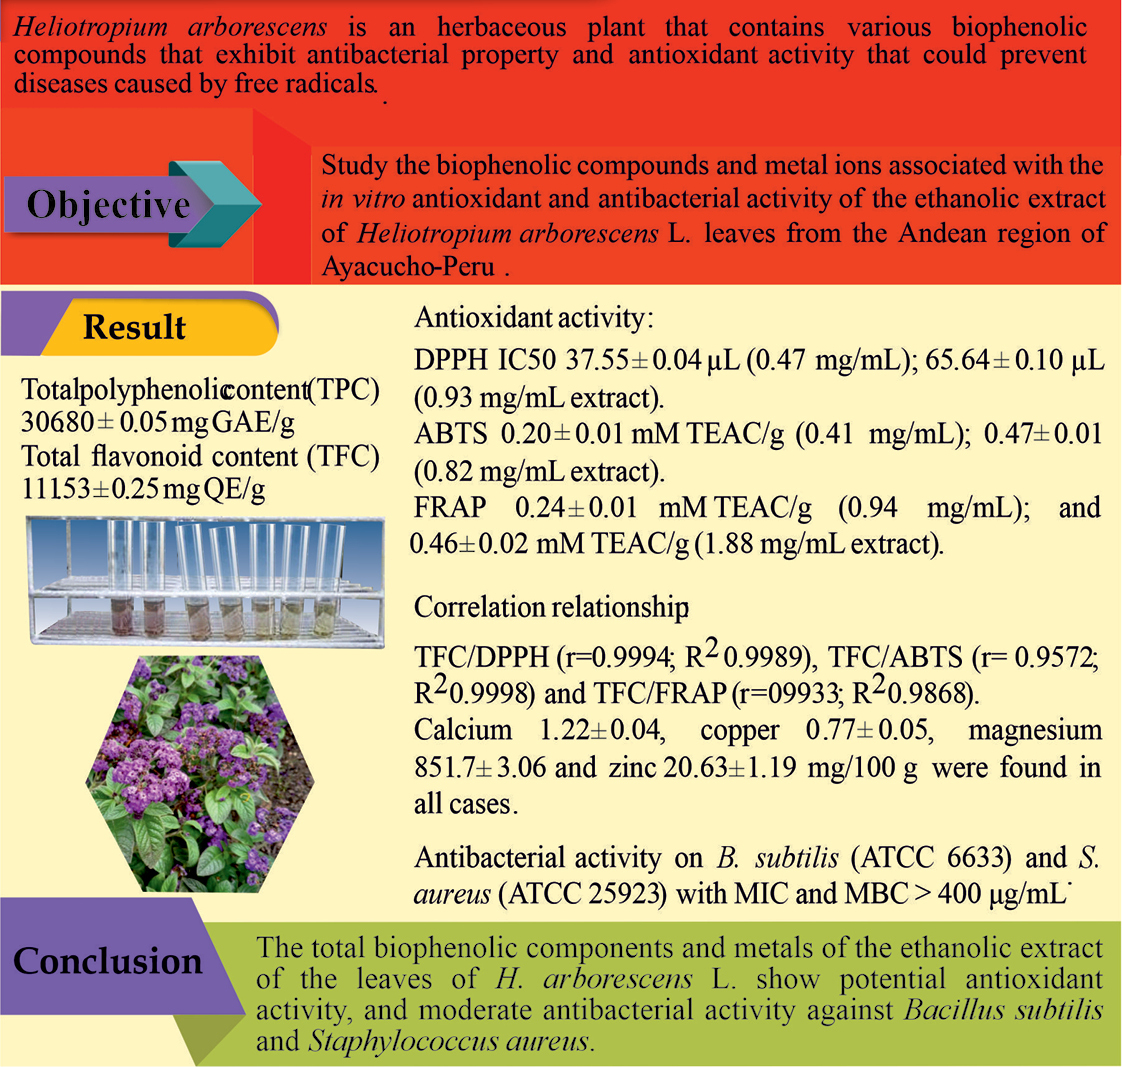
Heliotropium arborescens (
Graphical abstract:
Keywords
Heliotropium arborescens, flavonoids, biophenols, antioxidant, antibacterial
Introduction
The genus Heliotropium (helium in Greek means “sun”, tropium comes from the Greek word “tropein” which means to turn) belongs to the family Boraginaceae and subfamily Heliotropioideae (
In several studies, it has been proven that the biophenolic compounds of Heliotropium exhibit cardiotonic, antiplatelet, healing, anti-infectious (antiviral, antifungal, antibacterial) properties and antioxidant activity (
Various molecules such as nuclear factor kappa B (FN kB) and activating protein 1 (AP-1) can stimulate the mitochondrial superoxide dismutase (SOD2) genes, overexpressing the synthesis of their respective enzyme, forming excess hydrogen peroxide (H2O2); at the same time, the enzymatic system that metabolizes H2O2 is inactivated due to depletion of the NADPH enzymatic cofactors that are used in reactions that generate ROS (

The SciELO, PubMed-NCBI and ScienceDirect database was searched for published research on the species H. arborescens (heliotrope, curutmi or cayaraja), and it is evident that studies on this species are scarce, in this sense it is justified to carry out studies chemical preliminaries, in vitro and preclinical. Therefore, the objective was to study the biophenolic compounds and metal ions associated with the in vitro antioxidant and antibacterial activity of the ethanolic extract of Heliotropium arborescens L. leaves from the Andean region of Ayacucho-Peru.
Materials and methods
Plant materials
The samples were the leaves of the bush Heliotropium arborescens L. “heliotrope, curutmi or cayaraja” that was collected between February and March 2023 in the district of Pauza (Geographically located between 15°16'44"S, 73°20'50"W), altitude 2524 m.a.s.l, province of Paucar del Sara Sara, region of Ayacucho, zone of the Peruvian Andes. The climate is cold to temperate, rainy between December and March with a rainfall of 575 mm; from May to September it is dry and October to November in between; the temperature varies between 8 to 22 °C, in the capital of the department the average temperature is 17.5 °C (
Extraction and isolation
The H. arborescens L. plants were transported to the Instrumental Analysis laboratory of the Faculty of Pharmacy, Universidad Nacional San Luis Gonzaga de Ica, where they were dried under shade for 15 days, then the leaves were separated manually, and immediately ground in a manual mill (IVYMEN JP SELECTA, YCW-010E, Spain) to obtain a fine powder. Subsequently, 500 g of the fine powder was weighed (Sartorius model ED224S, Germany) and placed in an amber glass bottle, 96% ethanol was immediately added (sample: solvent 1:3) and to extract the bioactive compounds, it was shaken for 30 min daily for 15 days; after maceration, the liquid extract was filtered, and the solvent was evaporated in a rotary evaporator (Heidolph model LABOROTA 4000, Germany) at reduced pressure and 38±2 °C; the semisolid extract was placed in an oven (Binder series 05-75803, Germany), obtaining a dry extract that was stored in an amber bottle at 4 °C until analysis (
Phytochemical study
Through coloring and/or precipitation reactions, polyphenol-type secondary metabolites were identified in solvents of different polarities. In fraction A, flavonoids, phenols and tannins (A1) were identified; a 1% HCl solution was added to fraction A2, it was stirred, filtered, and an insoluble part and an acid solution were obtained; the insoluble part was washed with distilled water until neutral pH, then dissolved with 5 mL of dichloromethane, anhydrous sodium sulfate was added and filtered to obtain fraction B (with it, triterpenoids and/or steroids were identified). Subsequently, the acid solution was filtered, 25% ammonium hydroxide and dichloromethane were added to the filtered liquid, generating two phases (dichloromethane and aqueous). The dichloromethane phase was washed with distilled water, anhydrous sodium sulfate was added, filtered and fraction C was obtained (triterpenoids and/or steroids were identified); the aqueous phase was saturated with 5 g of anhydrous sodium sulfate, and a mixture of dichloromethane: ethanol (3:2) for extraction, forming an organic and an aqueous phase. The organic phase was washed with anhydrous sodium sulfate solution and saturated with 1 g of anhydrous sodium sulfate, filtered to obtain fraction D (flavonoids, triterpenoids and/or steroids, and alkaloids were identified); the aqueous residue was added to the aqueous phase (extraction result dichloromethane: ethanol), generating fraction E and with-it flavonoids and leucoanthocyanidins and/or catechins were identified (
Total polyphenol content
A calibration curve of the gallic acid standard (Sigma-Aldrich) in 70% alcohol was performed in the range of 1–7.5 µg/mL. 0.1 mL (900 µg/mL) of the ethanolic extract was reacted with 0.45 mL of Folin-Ciocalteu solution (Merck, ratio 1 reagent: 2 HPLC grade water), homogenized and allowed to react for 5 min; after that time, 0.45 mL of 20% sodium carbonate (Na2CO3) and HPLC grade water sufficient quantity for (sqf) 3 mL were added, and it was shaken vigorously to homogenize. It was reacted for 30 min under protection from light and at laboratory temperature. The absorbances of the samples and the blank were read in triplicate at a wavelength of 760 nm (Spectrophotometer Peak Instrumental, model C-7100, USA). The total polyphenolic content was expressed in mg of gallic acid (mg GAE)/g of ethanolic extract (
Determination flavonoids
In a 2 mL tube, 200 μL of the ethanolic extract and 1000 μL of distilled water were added and gently homogenized; then, 75 μL of 5% sodium nitrite (NaNO2) was added, mixed, and allowed to react for 5 min. After that time, 75 μL of 10% aluminum chloride (AlCl3) was added, gently homogenized, and allowed to react for 6 min, subsequently, 500 μL of 1 M sodium hydroxide (NaOH) was added. The mixture was allowed to stand for 5 min. A quercetin calibration curve of 50–500 μg/mL was prepared and evaluated simultaneously with the ethanolic extract. The absorbances of the samples were read in triplicate at a wavelength of 510 nm (Spectrophotometer Peak Instrumental, model C-7100, USA). The total flavonoid content was expressed in mg of quercetin/g of sample (
Antioxidant assay
DPPH radical scavenging assay
The 100 Mm DPPH (Sigma) solution was prepared in 80% methanol (Analytical grade, Beaker) and the absorbance was established between 0.9–1.1 at a wavelength of 517 nm (Spectrophotometer Peak Instrumental, model C- 7100 USA). Various 3 mL tubes were marked, then 0.1 mL of each of the dilutions of the ethanolic extract, plus 2.9 mL of DPPH solution, were added and homogenized. The homogenized mixture (ethanolic extract + DPPH) reacted for 30 min protected from light and at laboratory temperature; after the reaction time, the homogenized mixture and the blank (methanol) were measured in triplicate at a wavelength of 517 nm (Spectrophotometer Peak Instrumental, model C-7100 USA); the inhibition percentage (% Inh) was determined using the following formula:
%Inh. = [(blank abs – sample abs) / (blank abs)] × 100
The IC50 was determined from a curve of % inhibition vs µL of ethanolic extract (
Ferric Reducing Antioxidant Power (FRAP)
3 mL of freshly prepared reagent was added to a quartz cuvette and read at a wavelength of 593 nm (Spectrophotometer Peak Instrumental, model C-7100, USA). Subsequently, 0.1 mL of each of the ethanolic extracts plus 1.5 mL of the FRAP solution was added to marked tubes, homogenized in a vortex for 30 sec, then it was allowed to react for 6 min at laboratory temperature. The study sample (ethanolic extract + FRAP solution) was measured in triplicate at a wavelength of 593 nm (Spectrophotometer Peak Instrumental, model C-7100, USA). Trolox at a concentration of 0.0312–1.0 mM was used as a reference standard. The final absorbance was obtained by subtracting the value from the initial absorbance of the FRAP solution. A quantification curve of mM of Trolox/g of ethanolic extract was carried out. Previously, the FRAP solution was prepared, 25 mL of acetate buffer (300 mM, pH 3.6), 2.5 mL of TPTZ solution (2,4,6-tripyridyl-s-triazine) 10 mM diluted in HCl 40 mM and 2.5 mL of 20 mM ferric chloride (FeCl3.6H2O) solution (
ABTS radical scavenging activity
ABTS reagent (2,2'-azino-bis-(3-ethyl benzothiazolin-6-sulfonate ammonium) was reacted with potassium persulfate (K2S2O8) for 12 h and under the protection of light. 10 μL of the ethanolic extract and 990 μL of ABTS•+ radical solution was incorporated into a 3 mL tube, allowing the reaction to occur at 37 °C for 4 min. After that time, the homogenized mixture and the initial ABTS reagent were measured in triplicate at a wavelength of 734 nm (Spectrophotometer Peak Instrumental, model C-7100 USA). The results were expressed as values of mM of Trolox equivalent antioxidant capacity (TEAC)/g of dry extract (Trolox equivalent) by constructing a Trolox standard curve (
Determination of metals
In a porcelain crucible, 1 g of dry ethanolic extract was accurately weighed and immediately calcined on an electric kitchenette, subsequently, the calcined sample was incorporated into the muffle furnace at 500 °C for 4 h until gray ashes were obtained. Said ashes were allowed to cool to room temperature, then 10 mL of 10% HCl was added, brought to a boil, and allowed to cool. The acidified liquid was filtered through Whatman 2 paper into a 25 mL volumetric flask, and sufficient distilled water for 25 mL was immediately added. For the determination of calcium and magnesium, a 1:100 dilution was carried out, adding 10 mL of 1% lanthanum chloride to the final solution (to avoid interferences).
The determination of calcium, copper, magnesium, and zinc was carried out by flame atomic absorption spectrophotometry (FAAS: Perkin Elmer AA-800 spectrophotometer); said equipment was previously calibrated for each metal according to the manufacturer’s instructions (
Antibacterial activity by agar diffusion method
The strains Bacillus subtilis (ATCC 6633), Staphylococcus aureus (ATCC 25923), Escherichia coli (ATCC 25922) and Pseudomona aeruginosa (ATCC 28573) were activated in Mueller Hinton Broth (MHB) at 37 °C in a water bath with shaking for 24 h.
After activation, each strain was adjusted to a concentration of 108 CFU/mL compared to the standard 0.5 of the McFarland scale reading at 580 nm (Spectrophotometer Peak Instrumental, model C-7100, USA). The study mixture consisted of 9.95 mL of 1% sulfuric acid (H2SO4) and 0.05 mL of 1% BaCl2. The experiment was carried out by adding 20 mL of Mueller-Hinton Agar (MHA) to Petri dishes and allowing it to melt, then the bacterial cultures (1000 µL) were sown, distributing it evenly with a Drigalsky spatula. The plates were allowed to dry for 5 min, then six 6 mm diameter wells were made using a sterile punch.
50 μL of negative control (50% alcohol) was added to each plate, four sample concentrations of the plant extract (50, 100, 250 and 500 mg/mL), the concentrations were defined by previous tests, and oxacillin (5 µg/mL) was used as a positive control. All plates were refrigerated for 30 min, after which time they were incubated at 37 °C for 24 h. Antibacterial activity was detected by measuring the zone of inhibition (including the diameter of the wells) in mm using a calibrated Vernier. Tests were performed in triplicate for each strain (CLSI M07 2018;
Identification of the minimum inhibitory concentration (MIC)
The wells of the microplate were identified as columns to carry out the experiment: 200 µL of negative sterility control (190 µL MHB + 10 µL DMSO) was added to the well of column 1; in the following columns, the extract samples were incorporated (50 µL of extract sample at concentrations of 500, 250, 100 and 50 mg/mL + 50 µL of MHB + 100 µL of bacterial inoculum at a concentration of 108 CFU/mL according to the McFarland scale), and in the last column 200 µL of positive control (100 µL of MHB + 100 µL of inoculum) was incorporated. Oxacillin was dissolved with MHB and 200 µL was added to each well at concentrations 64, 49, 24.50, 12.25, 6.12, 3.06, 1.53, 0.76 and 0.38 μg/mL.
A negative sterility control (200 µL of MHB) and a positive control (100 µL of MHB and 100 µl of bacterial inoculum) were considered. The final volume of all wells was 200 μL.
All plates were incubated at 37 °C for 24 h. To evaluate bacterial growth (the variation from blue purple to pinkish color was observed). The MIC is measured visually as the lowest extract concentration at which the initial blue-purple coloration was maintained (no visible growth). All tests were in triplicate and the average of three values was reported as MIC and expressed in μg/mL (CLSI M07 2018;
Identification of the minimum bactericidal concentration (MBC)
The microplate wells that maintained the blue-purple color (indicates no visible growth of the bacteria) were considered for the identification of MBC. From these wells, 100 µL of sample was measured and seeded in Petri dishes with MHB. 100 µL of bacterial inoculum and oxacillin was used as a positive control, and MHB without inoculum and without antimicrobial was used as a negative control. The plates were incubated at 37 °C for 24 hours. The MBC was determined by observing those plates where the ethanolic extract sample was able to eliminate bacterial development, comparing it with the positive control. The average of three values was reported as MBC (
Results and discussion
Secondary metabolites of the ethanolic extract of Heliotropium arborescens L leaves were identified by the coloration and precipitation method. The most representative being flavonoids, phenols and tannins, triterpenoids and/or steroids, leucoanthocyanidins and/or catechins, and alkaloids (Table
Presence of secondary metabolites in the ethanolic extract of Heliotropium arborescens L leaves.
| Fractions | Secondary metabolites | Assay | Results | Observations |
|---|---|---|---|---|
| A | Flavonoids | Shinoda | + | Red coloring. |
| Phenols and tannins | Ferric chloride | + | Bluish green. | |
| B | Triterpenoids and/or steroids | Lieberman Burchard | + | Green coloring. |
| C | Triterpenoids and/or steroids | Lieberman Burchard | + | Green coloring. |
| D | Flavonoids | Shinoda | + | Red coloring. |
| Triterpenoids and/or steroids | Lieberman Burchard | + | Green coloring. | |
| Alkaloids | Dragendorff | + | Slight orange precipitate. | |
| Mayer | + | White or light-yellow precipitate. | ||
| Hager | + | Brown precipitate. | ||
| E | Flavonoids | Shinoda | + | Red coloring. |
| Leucoanthocyanidins and/or catechins | Rosenheim | + | Brown coloration. |
Estimation of the content of total polyphenols, flavonoids, and antioxidant activity of the ethanolic extract of Heliotropium arborescens L (curutmi) leaves.
| Assay | Concentration of ethanolic extract (mg/mL) | Mean±SD | 95%CI | *Reference compounds |
|---|---|---|---|---|
| TPC (mg GAE/g) | 1.12 | 306.80±0.05 | 0.0566 | Gallic acid |
| TFC (mg QE/g) | 1.17 | 111.53±0.25 | 0.2848 | Quercetin |
| DPPH (IC50) µL | 0.47 | 37.55±0.04 | 0.0397 | Trolox |
| 0.93 | 65.64±0.10 | 0.1161 | Trolox | |
| ABTS (mM TEAC/g) | 0.41 | 0.20±0.01 | 0.0095 | Trolox |
| 0.82 | 0.47±0.01 | 0.0099 | Trolox | |
| FRAP (mM TEAC/g) | 0.94 | 0.24±0.01 | 0.0058 | Trolox |
| 1.88 | 0.46±0.02 | 0.0174 | Trolox |
Table
The reduction capacity of the DPPH radical was determined by the decrease in absorbance at 515 nm, which indicates that the ethanolic extract has the capacity to capture reactive oxygen species (ROS) (
The third method applied to evaluate the antioxidant activity of the ethanolic extract of the leaves of H. arborescens L was FRAP, for this, two concentrations of the ethanolic extract were also used, observing that the bioactive compounds at the concentration of 1.88 mg/mL have the greater capacity to transfer an electron to the FRAP radical (SET) by reducing the ferric ion (Fe3+) to a ferrous ion (Fe2+), which is visualized by changing the color of the solution to intense blue. It has been determined that a high absorbance value is an indication of a strong reducing power that translates into a high antioxidant capacity of the bioactive compounds (
In a study carried out by
Fig.

Fig.

Fig.

Plant biophenolic compounds could sequester or form stable complexes of ROS preventing liperoxidation (

Table
Determination of metals from the ethanolic extract of H. arborescens L leaves.
| Sample | Calcium | Copper | Magnesium | Zinc |
|---|---|---|---|---|
| Mean±SD (mg/100 g) | Mean±SD (mg/100 g) | Mean±SD (mg/100 g) | Mean±SD (mg/100 g) | |
| Ethanolic extract of H. arborescens L. | 1.22±0.04 | 0.77±0.05 | 851.7±3.06 | 20.63±1.19 |
In various studies it has been shown that these trace elements or microminerals are enzymatic cofactors, such as the study by
The potential antibacterial activity of the ethanol extract of H. arborescens L. leaves was evaluated at concentrations of 5%, 10%, 25% and 50% on strains of Bacillus subtilis, Staphylococcus aureus, Escherichia coli and Pseudomona aeruginosa. Antibacterial activity was observed against B. subtilis and S. aureus, at concentrations of 250 mg/mL (25%) and 500 mg/mL (50%), using a volume of 50 μL, with minimum inhibitory concentration (MIC) and minimal bactericidal concentration (MBC) > 400 μg/mL. However, no concentration showed activity against E. coli and P. aeruginosa. Oxacillin (5 µg/mL) was used as an antibacterial positive control (Table
Percentage, inhibition diameter, minimum inhibitory concentration (MIC) and minimum bactericidal concentration (MBC) of the ethanolic extract of H. arborescens L leaves.
| Microorganism | Type | Extract concentration (mg/mL) | Extract inhibition | MIC | MBC | Oxacillin* | ||
|---|---|---|---|---|---|---|---|---|
| (%) (Mean±SD) | Diameter (Mean±SD mm) | (μg/mL) | (μg/mL) | % | Diameter (mm) | |||
| Bacillus subtilis ATCC 6633 | Gram+ | 250 | 69.76±1.80 | 69.76±1.80 | >400 | >400 | 100 | 14.33 |
| 500 | 77.86±2.58 | 77.86±2.58 | >400 | >400 | 100 | 14.33 | ||
| Staphylococcus aureus ATCC 25923 | Gram+ | 250 | 34.92±1.37 | 34.92±1.37 | >400 | >400 | 100 | 35.33 |
| 500 | 41.53±1.28 | 41.53±1.28 | >400 | >400 | 100 | 35.33 | ||
In a study on plants used in Brazilian popular medicine for the treatment of infectious diseases
The limitations of the research are that only the ethanolic extract of the leaves of H. arborescens L. was studied, and not having quantified, isolated, and elucidated the chemical structure of the biophenolic compounds responsible for the biological activity. Without prejudice to the above, we consider that this study is relevant, because it constitutes solid scientific evidence of this plant species, given that no reports of the antioxidant activity of leaf, stem or root extracts were found. Therefore, our research group is considering continuing to study this plant species in a second stage, to isolate the bioactive components, carry out preclinical studies in animal models, determine the toxicity of the therapeutic dose and evaluate the pharmacological effects.
Conclusions
Based on the results, it is concluded that the biophenolic components and metals of the ethanolic extract of the leaves of H. arborescens L. show potential antioxidant activity, and moderate antibacterial activity against Bacillus subtilis and Staphylococcus aureus.
Acknowledgement
To the members of the Molecular Pharmacology Society of Peru, for their fine contributions.
References
- Ahmad S, Ahmad S, Bibi A, Ishaq MS, Afridi MS, Kanwal F, Zakir M, Fatima F (2014) Phytochemical analysis, antioxidant activity, fatty acids composition, and functional group analysis of Heliotropium bacciferum. The Scientific World Journal 2014: 829076. https://doi.org/10.1155/2014/829076
- Alvarado AT, Muñoz AM, Tasayco-Yataco N, Gamarra-Castillo F, Ybañez-Julca RO, Bendezú MR, Chávez H, García JA, Surco-Laos F, Melgar-Merino EJ, Cuba-Garcia PA, Castillo-Romero P, Vega-Ramos N, Loja-Herrera B, Pineda-Pérez M, Bolarte-Arteaga M (2023) In vitro antioxidant and in vivo hypoglycemic activity of biophenols and polyunsaturated fatty acids from Vitis vinifera L. muscat and quebranta seeds from the Valley of Ica-Peru. Pharmacia 70: 733–744. https://doi.org/10.3897/pharmacia.70.e109129
- Alvarado AT, Muñoz AM, Bartra MS, Valderrama-Wong M, González D, Quiñones LA, Varela N, Bendezú MR, García JA, Loja-Herrera B (2021) Frequency of CYP1A1*2A polymorphisms and deletion of the GSMT1 gene in a Peruvian mestizo population. Pharmacia 68: 747–754. https://doi.org/10.3897/pharmacia.68.e71621
- Andzi Barhe´ T, Feuya Tchouya GR (2016) Comparative study of the anti-oxidant activity of the total polyphenols extracted from Hibiscus Sabdariffa L., Glycine max L. Merr., yellow tea and red wine through reaction with DPPH free radicals. Arabian Journal of Chemistry 9: 1–8. https://doi.org/10.1016/j.arabjc.2014.11.048
- Avello M, Suwalsky M (2006) Radicales libres, antioxidantes naturales y mecanismos de protección. Atenea 494: 161–172. https://doi.org/10.4067/S0718-04622006000200010
- Baroi A, Popiteu M, Fierascu I, Sardarescu I, Fierascu R (2022) Grapevine Wastes: A Rich Source of Antioxidants and Other Biologically Active Compounds. Antioxidants 11: 393. https://doi.org/10.3390/antiox11020393
- Carrasco Rueda JM, Guerrero AF, Chávez ÁS, Reyes JL, Quiroz AP, Castilla Candela LC, Bravo RN, Giraldi KO, Yarasca ÁA, Berta Loja Herrera, Granara AS (2013) Effect of the alkaloid extract from Jatropha curcas L. seeds on the intestinal motility [Efecto sobre la motilidad intestinal del extracto de alcaloides de semilla de Jatropha curcas L]. Revista Cubana de Plantas Medicinales 18: 84–91.
- Carvajal C (2019) Especies reactivas del oxígeno: formación, función y estrés oxidativo. Revista Medicina Legal de Costa Rica 36: 91–100.
- Chávez H, Palomino F, Angelino J, Torres E, Bendezú MR, García JA, Loja B, Muñoz AM, Alvarado AT (2021) In vivo bronchodilator evaluation of the ethanolic extract of the stems of Jatropha macrantha Müll.Arg. Journal of Pharmacy & Pharmacognosy Research 9: 937–946. https://doi.org/10.56499/jppres21.1109_9.6.937
- CLSI M07 [Clinical and Laboratory Standards Institute] (2018) Methods for Dilution Antimicrobial Susceptibility Tests for Bacteria That Grow Aerobically. 11th edn. document M07. Wayne, PA: National Committee for Clinical Laboratory Standard. https://clsi.org/media/1928/m07ed11_sample.pdf
- De la Cruz-Arango J, Gómez-Carrión J, Chanco-Estela M, Carrillo-Fuentes EP, Aucasime-Medina L (2020) Flora y vegetación de la provincia de Huamanga (Ayacucho-Perú). Journal of the Selva Andina Biosphere 8: 3–18. https://doi.org/10.36610/j.jsab.2020.080100003
- De Zoysa MHN, Rathnayake H, Hewawasam RP, Wijayaratne WMD (2019) Determination of In Vitro Antimicrobial Activity of Five Sri Lankan Medicinal Plants against Selected Human Pathogenic Bacteria. International Journal of Microbiology 2019:7431439. https://doi.org/10.1155/2019/7431439
- Fayed MAA (2021) Heliotropium; a genus rich in pyrrolizidine alkaloids: A systematic review following its phytochemistry and Pharmacology. Phytomedicine Plus 1: 100036. https://doi.org/10.1016/j.phyplu.2021.100036
- Fayed MAA, Abouelela ME, Refaey MS (2022) Heliotropium ramosissimum metabolic profiling, in silico and in vitro evaluation with potent selective cytotoxicity against colorectal carcinoma. Scientific reports 12: 12539. https://doi.org/10.1038/s41598-022-16552-1
- Galán de Mera A, Linares Perea E, Montoya Quino J, Vicente Orellana JA (2022) Nuevos datos sobre la vegetación del sur del Perú: adiciones a los departamentos de Arequipa, Cusco y Puno [New data on the vegetation of Southern Peru: Additions to the departments of Arequipa, Cusco and Puno]. Arnaldoa 29: 9–30.
- González-Torres MC, Betancourt-Rule M, Ortiz-Muñiz R (2000) Daño Oxidativo y Antioxidantes. Bioquimia 25: 3–9.
- Goyal N, Sharma S (2014) Bioactive phytoconstituents and plant extracts from genus Heliotropium. International Journal of Green Pharmacy 8: 217–225.
- Holetz FB, Pessini GL, Sanches NR, Cortez DA, Nakamura CV, Filho BP (2002) Screening of some plants used in the Brazilian folk medicine for the treatment of infectious diseases. Memorias do Instituto Oswaldo Cruz 97: 1027–1031. https://doi.org/10.1590/s0074-02762002000700017
- Hussain S, Jamil M, Ullah F, Khan A, Ullah F, Arfan M, Ahmad S, Khatoon L (2010) Antimicrobial and antioxidant activities of the plant heliotropium strigosum. African Journal of Biotechnology 9: 7738–7743.
- Luebert F, Weigend M, Hilger HH (2010) Epitypification of Heliotropium arborescens L. (Heliotropiaceae). Taxon 59: 1263–1266. https://doi.org/10.1002/tax.594023
- Luebert F (2020) Revisión de Heliotropium sects. Heliothamnus, Heliotrophytum, Hypsogenia, Plagiomeris y Platygine (Heliotropiaceae) en Chile. Gayana Botanica 77: 115–138. https://doi.org/10.4067/S0717-66432020000200115
- Macedo-Márquez A (2012) La producción de especies reactivas de oxígeno (EROs) en las mitocondrias de Saccharomyces cerevisiae. TIP Revista especializada en ciencias químico-biológicas 15: 97–103.
- Mendoza Isaza NA, Hoyos-Arbeláez JA, Peláez-Jaramillo CA (2020) Capacidad antioxidante y contenido de polifenoles totales de extractos de tallo de Stevia rebaudiana en varios modelos in vitro. Revista EIA 17: 1–9. https://doi.org/10.24050/reia.v17i34.1282
- Merino FJZ, Oliveira VB, Paula CS, Cansian FC, Souza AM, Zuchetto M, Hirota BCK, Duarte AFS, Kulik JD, Miguel MD, Miguel OG (2015) Análise fitoquímica, potencial antioxidante e toxicidade do extrato bruto etanólico e das frações da espécie Senecio westermanii Dusén frente à artemia salina. Revista Brasileira de Plantas Medicinais 17: 1031–1040. https://doi.org/10.1590/1983-084X/14_137
- Modak B, Arrieta A, Torres R, Urzua A (2002) Actividad antibacteriana de flavonoides aislados del exudado resinoso de Heliotropium sinuatum: efecto del tipo de estructura. Boletín de la Sociedad Chilena de Química 47. https://doi.org/10.4067/S0366-16442002000100005
- Modak B, Salina M, Rodilla J, Torres R (2009) Study of the chemical composition of the resinous exudate isolated from Heliotropium Sclerocarpum and evaluation of the antioxidant properties of the phenolic compounds and the resin. Molecules 14: 4625–4633. https://doi.org/10.3390/molecules14114625
- Modak B, Sandino AM, Arata L, Cárdenas-Jirón G, Torres R (2010) Inhibitory effect of aromatic geranyl derivatives isolated from Heliotropium filifolium on infectious pancreatic necrosis virus replication. Veterinary Microbiology 141: 53–58. https://doi.org/10.1016/j.vetmic.2009.09.005
- Murugesh K, Yeligar V, Dash DK, Sengupta P, Maiti BC, Maity TK (2006) Antidiabetic, antioxidant and antihyperlipidemic status of Heliotropium zeylanicum extract on streptozotocin-induced diabetes in rats. Biological and Pharmaceutical Bulletin 29: 2202–2205. https://doi.org/10.1248/bpb.29.2202
- Noumedem JA, Mihasan M, Lacmata ST, Stefan M, Kuiate JR, Kuete V (2013) Antibacterial activities of the methanol extracts of ten Cameroonian vegetables against Gram-negative multidrug-resistant bacteria. BMC Complementary Medicine and Therapies 13: 1–9. https://doi.org/10.1186/1472-6882-13-26
- Ogunbinu AO, Flamini G, Cioni PL, Adebayo MA, Ogunwande IA (2009) Constituents of Cajanus cajan (L.) Millsp., Moringa oleifera Lam., Heliotropium indicum L. and Bidens pilosa L. from Nigeria. Natural product communications 4: 573–578. https://doi.org/10.1177/1934578X0900400427
- Osungunna MO, Adedeji KA (2011) Phytochemical and antimicrobial screening of methanol extract of Heliotropium indicum leaf. Journal of Microbiology and Antimicrobials 3: 213–216.
- Ozntamar-Pouloglou KM, Cheilari A, Zengin G, Graikou K, Ganos C, Karikas GA, Chinou I (2023) Heliotropium procubens Mill: Taxonomic Significance and Characterization of Phenolic Compounds via UHPLC-HRMS- In Vitro Antioxidant and Enzyme Inhibitory Activities. Molecules 28: 1008. https://doi.org/10.3390/molecules28031008
- Prior RL, Wu X, Schaich K (2005) Standardized methods for the determination of antioxidant capacity and phenolics in foods and dietary supplements. Journal of Agricultural and Food Chemistry 53: 4290–4302. https://doi.org/10.1021/jf0502698
- Rahimyar N, Bagheri E, Asgarpanah G, Kabiri Balajadeh B, Yazdi H (2014) Antibacterial activity of total extract, petroleum ether, chloroform, ethyl acetate and aqueous fractions of aerial parts of Heliotropium bacciferum. Journal of Medicinal Plants 13: 122–135.
- Ramos-Escudero F, Muñoz AM, Alvarado-Ortíz C, Alvarado A, Yáñez JA (2012) Purple corn (Zea mays L.) phenolic compounds profile and its assessment as an agent against oxidative stress in isolated mouse organs. Journal of Medicinal Food 15: 206–215. https://doi.org/10.1089/jmf.2010.0342
- Rezanejad R, Heidarieh M, Ojagh SM, Rezaei M, Raeisi M, Alishahi A (2020) Values of antioxidant activities (ABTS and DPPH) and ferric reducing and chelating powers of gamma-irradiated rosemary extract”. Radiochimica Acta 108: 477–482. https://doi.org/10.1515/ract-2019-3113
- Rojas JJH, Aguilar ESC, Rojas MAQ, Paredes AML, Escobar SEL, Bocángel AAP, Villacorta FJR, Herrera BL, Yarasca AA, Calderón JM, Granara AS (2012) Efectos sobre la temperatura, frecuencia respiratoria, frecuencia cardiaca y electrocardiograma de Maytenus macrocarpa (Ruiz & Pav.) Briq. (chuchuhuasi). Revista Cubana de Plantas Medicinales 17: 233–243.
- Rueangsawang K, Chantaranothai P (2023) A taxonomic synopsis of Heliotropiaceae and new combinations in Heliotropium from Thailand. PhytoKeys 232: 189–210. https://doi.org/10.3897/phytokeys.232.103647
- Saeedi M, Morteza-Semnani K (2009) Chemical composition and antimicrobial activity of the essential oil of Heliotropium europaeum. Chemistry of Natural Compounds 45: 98–99. https://doi.org/10.1007/s10600-009-9239-8
- Sánchez-Valle V, Méndez-Sánchez N (2013) Estrés oxidativo, antioxidantes y enfermedad. Revista de Investigación Médica Sur México 20: 161–168.
- Sarkar C, Mondal M, Khanom B, Hossain MM, Hossain MS, Sureda A, Islam MT, Martorell M, Kumar M, Sharifi-Rad J, Al-Harrasi A, Al-Rawahi A (2021) Heliotropium indicum L.: From Farm to a Source of Bioactive Compounds with Therapeutic Activity. Evidence-Based Complementary and Alternative Medicine 2021: 9965481. https://doi.org/10.1155/2021/9965481
- Sharma P, Tripathi S, Chandra R (2020) Phytoremediation potential of heavy metal accumulator plants for waste management in the pulp and paper industry. Heliyon 6: e04559. https://doi.org/10.1016/j.heliyon.2020.e04559
- Sharma RA, Singh B, Singh D, Chandrawat P (2009) Ethnomedicinal, pharmacological properties and chemistry of some medicinal plants of Boraginaceae in India. Journal of Medicinal Plants Research 3: 1153–1175.
- Shetty K (2004) Role of proline-linked pentose phosphate pathway in biosynthesis of plant phenolics for functional food and environmental applications: a review. Process Biochemistry 39: 789–803. https://doi.org/10.1016/S0032-9592(03)00088-8
- Singh B, Sahu PM, Sharma RA (2017) Flavonoids from Heliotropium subulatum exudate and their evaluation for antioxidant, antineoplastic and cytotoxic activities II. Cytotechnology 69: 103–115. https://doi.org/10.1007/s10616-016-0041-8
- Sung H, Ferlay J, Siegel RL, Laversanne M, Soerjomataram I, Jemal A, Bray F (2021) Global Cancer Statistics 2020: GLOBOCAN Estimates of Incidence and Mortality Worldwide for 36 Cancers in 185 Countries. CA: A Cancer Journal for Clinicians 71: 209–249. https://doi.org/10.3322/caac.21660
- Surco-Laos F, García JA, Bendezú MR, Alvarado AT, Laos D, Valle M, Panay J, Palomino JJ, Yarasca PE, Muñoz AM, Bolarte M, Pineda M, Loja B (2023) Characterization of polyunsaturated fatty acids and antioxidant activity of Vitis vinifera L. (grape) seeds from the Ica Valley, Peru. Journal of Pharmacy & Pharmacognosy Research 11: 270–280. https://doi.org/10.56499/jppres23.1575_11.2.270
- Surco-Laos F, García J, Valle-Campos M, Panay-Centeno JF, Bonifaz-Hernandez M, Melgar EJ, Cuba-Garcia PA, Sullón-Dextre L, Alvarado AT (2022a) Compuestos bioactivos y actividad antioxidante in vitro del extracto etanólico e hidroalcohólico de Ricinus communis L. (Higuerilla). Revista Cubana de Farmacia 55: e840.
- Surco F, García JA, Bendezú MR, Laos D, Panay JF, Valle M, Palomino JJ, Yarasca PE, Loja B, Alvarado AT (2022b) In vitro antioxidant properties and antimicrobial activity of the ethanolic extract of Senecio nutans Sch. Beep. (Asteraceae). Journal of Pharmacy & Pharmacognosy Research 10: 1026–1036. https://doi.org/10.56499/jppres22.1471_10.6.1026
- Tenorio-Abreu A, Gil J, Bratos MA, de la Iglesia A, Borrás M, Ortiz R, Ávila A, Colomina J, Pérez JA, Saavedra JM, Márquez A, Domínguez A, de la Iglesia M (2015) Estudio multicéntrico sobre la actividad in vitro de ceftarolina frente a Staphylococcus aureus aislados en España [In vitro activity of ceftaroline against Spanish isolates of Staphylococcus aureus: a multicenter study]. Enfermedades Infecciosas y Microbiología Clínica 33: 101–104. https://doi.org/10.1016/j.eimc.2014.02.009
- Urzúa A, Modak B, Santander R, Heit C, Echeverría J (2013) Insecticidal properties of Heliotropium stenophyllum essential oil on the House fly, Musca domestica L. Boletín Latinoamericano y del Caribe de Plantas Medicinales y Aromáticas 12: 196–200.
- Valdés C, Valenzuela B, Modak B (2018) Evaluation in vitro of proliferative activity of epithelial cells by flavonoid 3-O-methylgalangine and terpenenic derivative Filifolinone. Boletín Latinoamericano y del Caribe de Plantas Medicinales y Aromáticas 17: 575–582.
- Vega A, De León J, Reyes S (2017) Determinación del Contenido de Polifenoles Totales, Flavonoides y Actividad Antioxidante de 34 Cafés Comerciales de Panamá. Información Tecnológica 28: 29–38. https://doi.org/10.4067/S0718-07642017000400005
- Velasco L, Goffman FD (1999) Chemotaxonomic significance of fatty acids and tocopherols in Boraginaceae. Phytochemistry 52: 423–426. https://doi.org/10.1016/S0031-9422(99)00203-4
- Willocx M, Van der Beeten I, Asselman P, Delgat L, Baert W, Janssens SB, Leliaert F, Picron JF, Vanhee C (2022) Sorting out the plants responsible for a contamination with pyrrolizidine alkaloids in spice seeds by means of LC-MS/MS and DNA barcoding: Proof of principle with cumin and anise spice seeds. Food chemistry 4: 100070. https://doi.org/10.1016/j.fochms.2021.100070
- Wongpratate M, Ishida W, Phuthong S, Natphopsuk S, Ishida T (2020) Genetic polymorphisms of the human cytochrome P450 1A1 (CYP1A1) and cervical cancer susceptibility among Northeast Thai women. Asian Pacific Journal of Cancer Prevention 21: 243–248. https://doi.org/10.31557/APJCP.2020.21.1.243