Research Article |
|
Corresponding author: Iyan Sopyan ( i.sopyan@unpad.ac.id ) Academic editor: Milen Dimitrov
© 2023 Iyan Sopyan, Wuri Ariestika Sari, Sandra Megantara, Taofik Rusdiana.
This is an open access article distributed under the terms of the Creative Commons Attribution License (CC BY 4.0), which permits unrestricted use, distribution, and reproduction in any medium, provided the original author and source are credited.
Citation:
Sopyan I, Ariestika Sari W, Megantara S, Rusdiana T (2023) Solubility enhancement of carvedilol by multicomponent crystal approach using glycine and arginine as coformers. Pharmacia 70(4): 1479-1486. https://doi.org/10.3897/pharmacia.70.e112271
|
Abstract
A Carvedilol is a member of BCS class II, it has a low solubility and bioavailability. This work intends to increase the solubility of carvedilol using a multicomponent crystal method. Based on in silico investigations showed that carvedilol-arginine formed one hydrogen bond and carvedilol-glycine formed two hydrogen bonds. Compared to the solubility of pure carvedilol, CVD: GLY multicomponent crystal ratios of 1:1, 1:2, and 2:1 resulted in increases in solubility of 1.9 times, 2.6 times, and 2.5 times respectively. The solubility of the multicomponent crystals in the CVD:ARG however, did not increase. The best dissolution profile was provided by multicomponent crystal CVD: GLY (1:2), with a % dissolution of 86.03% in HCl medium pH 1.45 and 29.5% in phosphate buffer medium pH 6.8. The results of characterization included FTIR, DSC, PXRD, and SEM evaluation of CVD: GLY multicomponent crystal (1:2) indicated the formation of a new solid crystalin phase. CVD: GLY multicomponent crystal (1:2) showing the best solubility and dissolution profile as compared to pure carvedilol.
Keywords
Solubility, carvedilol, multicomponent crystal, glycine, arginine
Introduction
Oral administration is the most common and feasible drug delivery route. A medicine must dissolve in the digestive fluids before it can be taken orally and be absorbed into the blood and reach its target. Solubility is a significant factor in successfully achieving medication concentrations in the systemic circulation and producing the desired therapeutic effect (
Carvedilol is a non-selective β-adrenergic inhibitor indicated in the management of coronary artery disease, heart failure, and hypertension. Based on the Biopharmaceutical Classification System (BCS), carvedilol is included in BCS class II. Carvedilol’s low solubility is one of the main causes associated with carvedilol’s low systemic bioavailability (25–35%) in the oral route of carvedilol. Carvedilol solubility in water was found to be very low at <1 µg/ml above pH 9.0, 23 µg/ml at pH 7, and 100 µg/ml at pH 5 (
Several approaches have been used to tackle the problem of carvedilol’s low solubility, including modification of the drug’s physical and chemical properties. These include changing the solid form into an amorphous form, increase wettability and porosity, and minimizing the particle size to enhance the effective surface area (
The advantage of the multicomponent crystal technique is that the medicine is in a stable crystal form and the formulation does not need excipients or other ingredients. The primary benefit of the multicomponent crystal technique is that it enables the active pharmaceutical components’ physicochemical qualities to be improved without impacting their pharmacological properties (
In this investigation, coformers of the amino acids arginine and glycine are employed. Amino acids are structurally promising coformers because of their functional groups’ capacity to establish hydrogen bonds and their zwitterion group’s capacity to boost stability through the support of strong contacts. Additionally, amino acid group coformers are recognized as generally safe (GRAS), demonstrating that amino acids are safe and have minimal toxicity. (
Materials and methods
Materials
Arginine (Merck), aquadest, hydrochloric acid (Merck), potassium bromide (Merck), potassium phosphate (Merck), carvedilol (Kalbe), glycine (Merck), methanol p.a. (Merck).
In silico study
ChemDraw 15.0 was used to create the 2D structures of carvedilol and its coformers (glycine and arginine). The optimization of the 3D shape structure was carried out using Chem3D Ultra 15.0 and the MM2 (Molecular Mechanic-2 Minimization) energy minimization process was carried out. In the AutoDock Tools 1.5.6 program, hydrogen atoms and charge are added and saved in pdbqt format. The PyRx program (Vina) was used to determine the binding affinity of the arginine coformer with carvedilol. The interactions formed were observed using the AutoDock Tools 1.5.6 application. The parameters observed were tp predict the bond distance, interaction energy, and type of interaction between the coformer and carvedilol (hydrogen bonds, van der Waals bonds, and π-π bonds) (
Multicomponent crystal preparation
Carvedilol multicomponent crystals with mole ratios of 1:1, 1:2, and 2:1 was prepared using the solvent evaporation method. Carvedilol was dissolved in methanol and coformer (arginine, glycine) was dissolved in distilled water. Solvent selection was based on the solubility profile of the constituent ingredient. The mixture was then stirred until fully dissolved. At room temperature, the solvent was allowed to slowly evaporate in an evaporating dish for 24 hours (
Evaluation of multicomponent crystal
Saturated solubility test
Samples of pure carvedilol, multicomponent crystals CVD: ARG and multicomponent crystals CVD: GLY equivalent to 10 mg pure carvedilol were dissolved in 10 mL of distilled water. The samples were stirred at room temperature for 24 hours using a shaker at 120 rpm. The sample was then filtered through Whatman filter paper (No. 42), and a UV-Vis spectrophotometer at 285 nm was performed to measure the amount of drug that had been dissolved (
Dissolution test
The HCl medium pH 1.45 and the phosphate buffer medium pH 6.8 were used as the dissolution media for the dissolution test. The dissolution test was conducted in 900 mL of dissolution medium at 50 rpm while maintaining a 37 ± 0.5 °C temperature. Dissolution testing used the paddle method. The test samples, namely pure carvedilol and multicomponent carvedilol crystals, were weighed in the equivalent of 25 mg. The sample is then put into the dissolution medium. Samples were taken as much as 10 mL at intervals of 5, 10, 15, 20, 30, 45, and 60 minutes. To maintain sink conditions, the volume of the dissolution media was kept at 900 mL by replacing it every time a sample was taken with new media. the samples were analyzed with a UV-Vis spectrophotometer at a 285 nm wavelength (
Characterization of multicomponent crystal
Fourier transform infrared (FTIR)
The individual FTIR spectra of pure carvedilol, pure coformer, physical mixture, and carvedilol multicomponent crystals were obtained using FTIR. A total of 1 mg of sample was added to 60 mg of potassium bromide (KBr) and compacted to create pellets. The spectrum was scanned in the range of 4000–400 cm-1 with a spectral resolution of 4 cm-1 (
Differential scanning calorimetry (DSC)
Differential Scanning Calorimetry (DSC) was used for analyzing thermal properties of pure carvedilol, pure coformer, physical mixture, and multicomponent carvedilol crystals. Approximately 3 mg sample was heated until 350 °C in an aluminum container at a heat rate of 10 °C/min under a nitrogen atmosphere (50 ml/min) (
Powder X-ray diffraction (PXRD)
The diffractogram patterns of pure carvedilol, pure coformer, physical mixture, and carvedilol multicomponent crystals were obtained using an X-ray powder diffractometer operating at an electric voltage of 40 kV, a current of 40 mA, using Cu-Kα radiation (λ = 1.5418). A total of 100–200 mg of sample is placed in the sample holder, and the sample is scanned in the range 5 – 60° (2θ), at a step size of 0.0167° and a step time of 0,5 seconds (
Results and discussion
In silico study
Through in silico study, it is possible to observe the interaction of carvedilol with the coformer, such as the type of interaction formed (Table
| Compound | Complex structure | Interaction | Hydrogen binding energy (kkal/mol) | Hydrogen bonding distance (Å) |
|---|---|---|---|---|
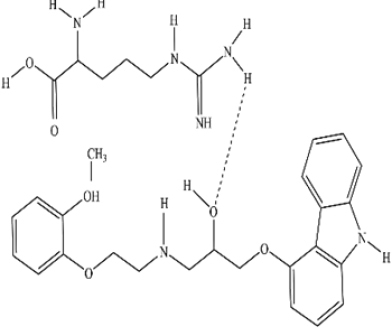
| CVD: ARG | 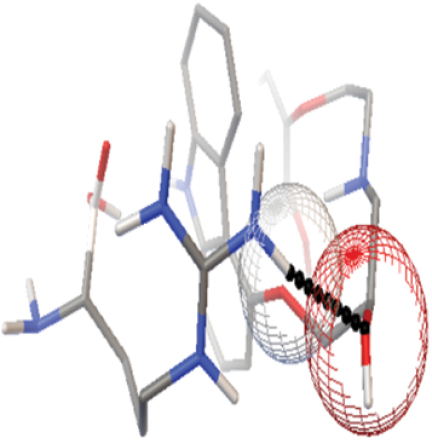 |
1 hydrogen bond | -6,224 | 1,939 |
 |
||||
| CVD: GLY | 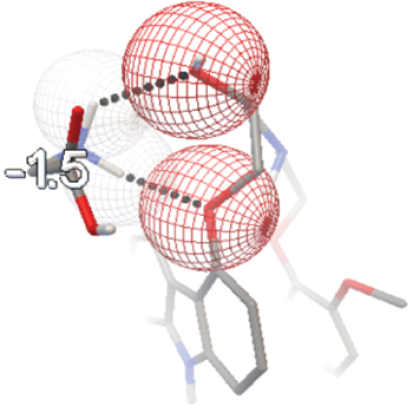 |
2 hydrogen bonds | -1,412 | 2,241; |
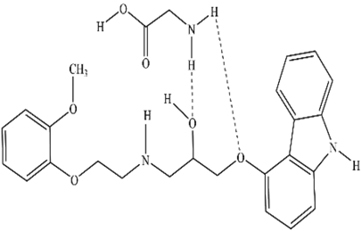 |
-5,042 | |||
| 2,045 |
Based on the in silico results, CVD:ARG forms one hydrogen bond with an energy of -6.224 kcal/mol and a hydrogen bond distance of 1.939 Å. The oxygen atom of the carvedilol hydroxyl group acts as a hydrogen acceptor and the amine group of arginine as a hydrogen donor to form a hydrogen bond.
Meanwhile, CVD:GLY forms 2 hydrogen bonds. The first hydrogen bond is formed between the amine group of glycine as a hydrogen donor and the oxygen atom on the hydroxyl group in the carvedilol aliphatic chain as a hydrogen acceptor. The hydrogen bond energy formed is -1.412 kcal/mol and the hydrogen bond distance is 2.241 Å. The oxygen atom in the ether group of carvedilol, acting as a hydrogen acceptor, and the amine group of glycine, acting as a hydrogen donor, form the second hydrogen bond. The hydrogen bond distance is 2.045 Å, and the hydrogen bond energy formed is -5.042 kcal/mol. The interactions that occur in CVD:ARG and CVD:GLY are classified as heterosynthone supramolecules because the groups that interact in forming hydrogen bonds are different. Based on the structure of carvedilol and coformer, there are functional groups that can act as proton donor and proton acceptors. So that when carvedilol is mixed with a coformer that also has a proton acceptor or donor, hydrogen bonds are likely to form between carvedilol and coformer. Hydrogen bonds are non-covalent interactions that form between hydrogen atoms attached to electronegative atoms such as oxygen or nitrogen atoms. Hydrogen bonds are becoming a critical factor in the multicomponent crystal approach. Hydrogen bonding interactions help stabilize most of the multicomponent crystal structures reported in the Cambridge Structural Database (CSD). In multicomponent crystal systems, hydrogen bonds can form supramolecular synthons and stabilize molecular structures even though they are weak individually (
A straightforward method to forecast the type formation of multicomponent crystals is to contrast the pKa values of the various components of the multicomponent crystal as in Table
| Compound | pKa | ΔpKa |
|---|---|---|
| Carvedilol (CVD) | 7,80 | - |
| Arginine (Arg) | 12,5 | 4,7 |
| Glycine (Gly) | 9,6 | 1,8 |
In the multicomponent CVD:ARG crystal, it is estimated that salt formation will occur because the ΔpKa value > 4. Meanwhile, in the multicomponent crystal CVD:GLY, it is estimated that cocrystals are formed because the ΔpKa value <2.
Evaluation of multicomponent crystal
Saturated solubility test
Fig.

The multicomponent crystals of CVD: GLY showed increased solubility compared to pure carvedilol in the solubility test results (Fig.
A one-way ANOVA statistical test and a follow-up test using Tukey’s post hoc test were used to ascertain whether there was any significant difference between pure carvedilol and carvedilol multicomponent crystals. The findings for the crystal multicomponent CVD showed that there was no discernible difference between ARG and pure carvedilol (p > 0.05). In the meantime, as the value (p < 0.05) shows, there was a substantial difference between each adjustment in the mole ratio of the CVD: GLY multicomponent crystal and the solubility of pure carvedilol.
Dissolution test
Dissolution tests were carried out on crystal multicomponent samples with coformers which showed an increase in solubility, namely CVD:GLY 1:1, 1:2, and 2:1 mole ratio compared to pure carvedilol. According to the USP Pharmacopeia standards, the dissolution medium for carvedilol is hydrochloric acid with a pH of 1.45. The dissolution test was conducted in HCl medium pH 1.45 and phosphate buffer medium pH 6.8 to determine the dissolution profile of CVD:GLY multicomponent crystals in acidic and intestinal mediums that represent the pH of the digestive tract and to observe the trend of multicomponent crystal dissolution profiles.
Figs


CVD:GLY crystal multicomponent (1:2) gave the best % dissolution increase in phosphate buffer medium pH 6.8. Meanwhile, in the dissolution test of HCl medium pH 1.45, the best % increase in dissolution occurred in the crystal multicomponent CVD:GLY (1:1), followed by a ratio of 1:2 and 2:1. However, the crystal multicomponent CVD:GLY (1:1) showed a lower % dissolution than pure carvedilol in phosphate buffer medium pH 6.8. Thus, the multicomponent crystal CVD:GLY (1:2) was chosen to proceed to the next evaluation, because the multicomponent crystal CVD:GLY (1:2) showed a significant increase in % dissolution in both dissolution media, namely in HCl dissolution medium pH 1.45 and phosphate buffer medium pH 6.8. In phosphate buffer medium pH 6.8, % dissolution in 60 minutes reached 29.5%. Whereas in HCl medium pH 1.45% dissolution reached 86.03% in 60 minutes.
Statistical tests were conducted on the dissolution test results of pure carvedilol and CVD:GLY multicomponent crystals using the one-way ANOVA test, followed by the Tuckey HSD post-hoc test with IBM SPSS Statistics 25 software, at a confidence level of 95%. Based on the results of the Tuckey HSD post-hoc test which aimed to identify groups with significant differences, it was observed that all ratio variations of the CVD:GLY multicomponent crystals exhibited significant differences compared to pure carvedilol under acidic conditions (pH 1.45). Meanwhile, in the dissolution test conducted in phosphate buffer medium at pH 6.8, the results indicated that only the CVD:GLY multicomponent crystal with a 1:2 ratio showed a significant difference when compared to pure carvedilol.
Based on the dissolution test results in HCl medium (pH 1.45) and phosphate buffer pH 6.8, it can be concluded that carvedilol and CVD: GLY multicomponent crystal had a higher % dissolution in HCl medium pH 1.45. Carvedilol is a weak base drug so it will dissolve more easily in an acidic environment. Meanwhile, glycine is a group of amino acids composed of two chemical groups, namely the amine group (-NH2) which is basic and the carboxyl group (-COOH) which is acidic. The existence of these two groups causes amino acids to react with both acids and bases.
Characterization of multicomponent crystal
Fourier transform infrared (FTIR) result
The formation of multicomponent crystals can be showed by indication of peak shifts, changes in peak intensity, or the emergence of new peaks in the infrared spectrum. Fig.

The peak at 3344 cm-1 in the FTIR spectra of pure carvedilol indicated the N-H stretching group. In addition to the N-H peak, at the peak of 3248–3400 cm-1 a broadening of the peak was observed indicating an O-H vibration that appears simultaneously with N-H (Table
Analysis of functional group FTIR spectra of pure carvedilol, crystal multicomponent CVD:GLY (1:2), and physical mixture of CVD:GLY (1:2).
| Functional group | Carvedilol (cm-1) | Glycine (cm-1) | CVD:GLY (1:2) multicomponent crystal (cm-1) | CVD:GLY (1:2) physical mixture (cm-1) |
|---|---|---|---|---|
| N-H | 3344,57 | 3350 | 3402,43 | 3344,57 |
| C-H | 3061,03; 2922,16 | 3159 | 3061,03; 2922,16 | 3061,03; 2922,16 |
| C-O | 1255,65 and 1215,15 | – | 1255,65 and 1217,08 | 1255,65 and 1215,15 |
| C=C | 1591,27 | – | 1591,27 | 1591,27 |
| C-N | 1332,81 | 1138,21 | 1332,81 | 1332,81 |
According to the physical mixture of CVD: GLY (1:2) FTIR spectrum results, there is no peak shift or difference with the FTIR spectrum of pure carvedilol, this showed that in the physical mixture of CVD: GLY (1:2), there was only physical interaction and no hydrogen interaction. Meanwhile, the peak wave number of the N-H group in the CVD: GLY (1:2) multicomponent crystal shifted from 3344.57 cm-1 to 3402.43 cm-1. Additionally, at the C-O group’s peak, the peak wave number also shifted from 1215.15 cm-1 to 1217.08 cm-1. The shift in wavenumber suggests that carvedilol and glycine functional groups have formed hydrogen bonds (
Differential scanning calorimetry (DSC) result
The thermal characteristics of multicomponent crystals were analyzed using DSC measurements. Fig.

The pure carvedilol DSC thermogram’s results revealed an endothermic peak indicating the drug’s melting point at 111.35 °C and an enthalpy value of -23.66 J/g. Pure glycine’s DSC thermogram revealed an endothermic peak with a melting point of 251.05 °C. On the DSC thermogram of the physical mixture CVD: GLY (1:2) two endothermic peaks can be observed, where the first endothermic peak had a similar peak to that of pure carvedilol at 111.92 °C which is close to the melting point of pure carvedilol. The second endothermic peak is shown at 255.76 °C which is also similar to the melting point of the pure glycine coformer. Thus, it can be said that there is no interaction between carvedilol and glycine molecules in the physical mixture CVD: GLY (1:2).
Two endothermic peaks could be seen on the CVD: GLY (1:2) multicomponent crystal’s thermogram. The first endothermic peak appeared at a temperature before the melting point of pure carvedilol, which is at 108.54 °C with a lower enthalpy than pure carvedilol, which is -7.61 J/g. The decrease in melting point and enthalpy explains the increase in solubility that occurs in the CVD: GLY (1:2) multicomponent crystal. Based on research, most cases of multicomponent crystals show lower melting points than drugs and coformers (
Powder X-ray diffraction (PXRD) result
Fig.

With additional peaks at 18.94°, 25.25°, and 29.8°, the diffractogram of the CVD: GLY physical mixture (1:2) resembled the pattern of carvedilol. There was no change in peak intensity or percentage crystallinity in the physical mixture diffractogram as compared to pure carvedilol. Peak features of the CVD-GLY (1:2) multicomponent crystal diffractogram, on the other hand, revealed novel peaks at 18.94°, 25.25°, 29.8°, and 36.57°, but otherwise had a pattern similar to that of pure carvedilol. When compared to pure carvedilol, the percentage of crystallinity in the CVD: GLY (1:2) multicomponent crystal dropped to 84.4%. The peak intensity of the multicomponent crystal CVD: GLY (1:2) was relatively lower than pure carvedilol and pure glycine. In general, new peak formation and a decrease in crystallinity are indications that multicomponent crystals are forming a new solid crystalline phase. The physicochemical characteristics of multicomponent crystals, such as solubility and dissolution, will be impacted by the change in crystal phase. (
Conclusion
Carvedilol interacted with each coformer, generating two hydrogen bonds with the glycine coformer and one hydrogen bond with the arginine coformer, according to in silico research. Among the other comparisons, CVD:GLY (1:2) indicated the best saturated solubility and dissolution profile. The saturated solubility test yielded a 2.6-fold increase for the CVD:GLY (1:2) multicomponent crystal; the percentage of dissolution reached 86.03% in HCl medium pH 1.45 and 29.5% in phosphate buffer medium pH 6.8. The characterization results of multicomponent crystal CVD:GLY (1:2) included FTIR spectrum shifts which indicated hydrogen interaction between carvedilol and the glycine coformer, the thermogram pattern from the DSC results showed a decrease in melting point and enthalpy, and based on the PXRD diffractogram there is a new peak and a decrease in % crystallinity in CVD:GLY (1:2) multicomponent crystal, which indicates the formation of new solid phase.
Acknowledgements
We acknowledge to DRPMI universitas Padjadjaran and Kemendikbud RI for funding of these research.
References
- Berry DJ, Steed JW (2017) Pharmaceutical cocrystals, salts and multicomponent systems; intermolecular interactions and property based design. Advanced Drug Delivery Reviews 117: 3–24. https://doi.org/10.1016/j.addr.2017.03.003
- Chatterjee B, Pal TK (2010) Development and in vitro evaluation of micronized sustained release matrix tablet of carvedilol. International Journal of Pharmaceutical Sciences and Research 1: 96–102.
- Childs SL, Zaworotko MJ (2009) The reemergence of cocrystals: The crystal clear writing Is on the wall introduction to virtual special issue on pharmaceutical cocrystals. Crystal Growth and Design 9: 4208–4211. https://doi.org/10.1021/cg901002y
- Doloking H, Sartika AT, Tahar N (2021) Formation of hydrochlorothiazide – para-aminobenzoic Acid cocrystals by solvent evaporation method. ad-Dawaa’ Journal of Pharmaceutical Sciences 4: 16–25. https://doi.org/10.24252/djps.v4i1.21301
- Eesam S, Bhandaru JS, Naliganti C, Bobbala RK, Akkinepally RR (2020) Solubility enhancement of carvedilol using drug-drug cocrystallization with hydrochlorothiazide. Future Journal of Pharmaceutical Sciences 6: 77. https://doi.org/10.1186/s43094-020-00083-5
- Fernandes GJ, Kumar L, Sharma K, Tunge R, Rathnanand M (2018) A review on solubility enhancement of carvedilol-a bcs class II drug. Journal of Pharmaceutical Innovation 13: 197–212. https://doi.org/10.1007/s12247-018-9319-z
- Hairunnisa H, Sopyan I, Gozali D (2019) Ko-Kristal: Nikotinamid sebagai koformer. Jurnal Ilmiah Farmako Bahari 10: e113. https://doi.org/10.52434/jfb.v10i2.652
- Janakiraman AK, Sumathi B, Mohamed Saleem T, Ramkanth S, Odaya Kumar P, Venkatachalam G (2017) Design and evaluation of Carvedilol nanocrystals sustained release tablets. Journal of Applied Pharmaceutical Science 7: 61–68. https://doi.org/10.7324/JAPS.2017.70408
- Jhaveri M, Nair AB, Shah J, Jacob S, Patel V, Mehta T (2020) Improvement of oral bioavailability of carvedilol by liquisolid compact: optimization and pharmacokinetic study. Drug Delivery and Translational Research 10: 975–985. https://doi.org/10.1007/s13346-020-00734-3
- Kang Y, Gu J, Hu X (2017) Syntheses, structure characterization and dissolution of two novel cocrystals of febuxostat. Journal of Molecular Structure 1130: 480–486. https://doi.org/10.1016/j.molstruc.2016.10.044
- Kumar S, Nanda A (2018) Approaches to design of pharmaceutical cocrystals: A review. Molecular Crystals and Liquid Crystals 667: 54–77. https://doi.org/10.1080/15421406.2019.1577462
- Liu M, Hong C, Yao Y, Shen H, Ji G, Li G, Xie Y (2016) Development of a pharmaceutical cocrystal with solution crystallization technology: Preparation, characterization, and evaluation of myricetin-proline cocrystals. European journal of pharmaceutics and biopharmaceutics 107: 151–159. https://doi.org/10.1016/j.ejpb.2016.07.008
- Loftsson T, Brewster ME (2010) Pharmaceutical applications of cyclodextrins: Basic science and product development. Journal of Pharmacy and Pharmacology 62: 1607–1621. https://doi.org/10.1111/j.2042-7158.2010.01030.x
- Musfikah A, Fitrah M, Farmasi J, Ilmu F, Universitas K, Negeri I, Makassar A (2015) Karakterisasi kokristal parasetamol – asam suksinat melalui metode solvent drop grinding. Jurnal Farmasi 2: 108–114.
- Prado LD, Rocha HVA, Resende JALC, Ferreira GB, De Figuereido Teixeira AMR (2014) An insight into carvedilol solid forms: Effect of supramolecular interactions on the dissolution profiles. CrystEngComm 16: 3168–3179. https://doi.org/10.1039/c3ce42403k
- Putra OD, Uekusa H (2020) Pharmaceutical multicomponent crystals: Structure, design, and properties. In: Sakamoto M, Uekusa H (Eds) Advances in Organic Crystal Chemistry: Comprehensive Reviews 2020. Springer Singapore, Singapore, 153–184. https://doi.org/10.1007/978-981-15-5085-0_9
- Rajurkar V (2015) Tablet Formulation and enhancement of aqueous solubility of efavirenz by solvent evaporation co-crystal technique. Medicinal Chemistry 08. https://doi.org/10.4172/2161-0444.1000002
- Saganowska P, Wesolowski M (2018) DSC as a screening tool for rapid co-crystal detection in binary mixtures of benzodiazepines with co-formers. Journal of Thermal Analysis and Calorimetry 133: 785–795. https://doi.org/10.1007/s10973-017-6858-3
- Sathisaran I, Dalvi SV (2018) Engineering cocrystals of poorlywater-soluble drugs to enhance dissolution in aqueous medium. Pharmaceutics 10: е108. https://doi.org/10.3390/pharmaceutics10030108
- Savjani KT, Gajjar AK, Savjani JK (2012) Drug solubility: Importance and enhancement techniques. ISRN Pharmaceutics 2012: 1–10. https://doi.org/10.5402/2012/195727
- Sharma A, Jain C (2010) Preparation and characterization of solid dispersions of Carvedilol with PVP K30. Research in pharmaceutical sciences 5: 49–56. https://doi.org/10.4067/S0717-97072013000100012
- Shete A, Murthy S, Korpale S, Yadav A, Sajane S, Sakhare S, Doijad R (2015) Cocrystals of itraconazole with amino acids: Screening, synthesis, solid state characterization, in vitro drug release and antifungal activity. Journal of Drug Delivery Science and Technology 28: 46–55. https://doi.org/10.1016/j.jddst.2015.05.006
- Siswandi S, Rusdiana T, Levita J (2015) Virtual screening of co-formers for ketoprofen co-crystallization and the molecular properties of the co-crystal. Journal of Applied Pharmaceutical Science 5: 078–082. https://doi.org/10.7324/JAPS.2015.50613
- Sopyan I, Fudholi A, Muchtaridi M, Sari IP (2017) Simvastatin-nicotinamide co-crystal: Design, preparation and preliminary characterization. Tropical Journal of Pharmaceutical Research 16: 297–303. https://doi.org/10.4314/tjpr.v16i2.6
- Tapas A, Kawtikwar P, Sakarkar D (2012) An improvement in physicochemical properties of carvedilol through spherically agglomerated solid dispersions with PVP K30. Acta Poloniae Pharmaceutica – Drug Research 69: 299–308.
- Thenge R, Patel R, Kayande N, Mahajan N (2020) Co-crystals of carvedilol: Preparation, characterization and evaluation. International Journal of Applied Pharmaceutics 12: 42–49. https://doi.org/10.22159/ijap.2020v12i1.35640
- Wen X, Tan F, Jing Z, Liu Z (2004) Preparation and study the 1:2 inclusion complex of carvedilol with β-cyclodextrin. Journal of Pharmaceutical and Biomedical Analysis 34: 517–523. https://doi.org/10.1016/S0731-7085(03)00576-4
- Zheng X, Wang T, Jiang H, Li Y, Jiang T, Zhang J, Wang S (2013) Incorporation of Carvedilol into PAMAM-functionalized MWNTs as a sustained drug delivery system for enhanced dissolution and drug-loading capacity. Asian Journal of Pharmaceutical Sciences 8: 278–286. https://doi.org/10.1016/j.ajps.2013.09.001