|
||
|
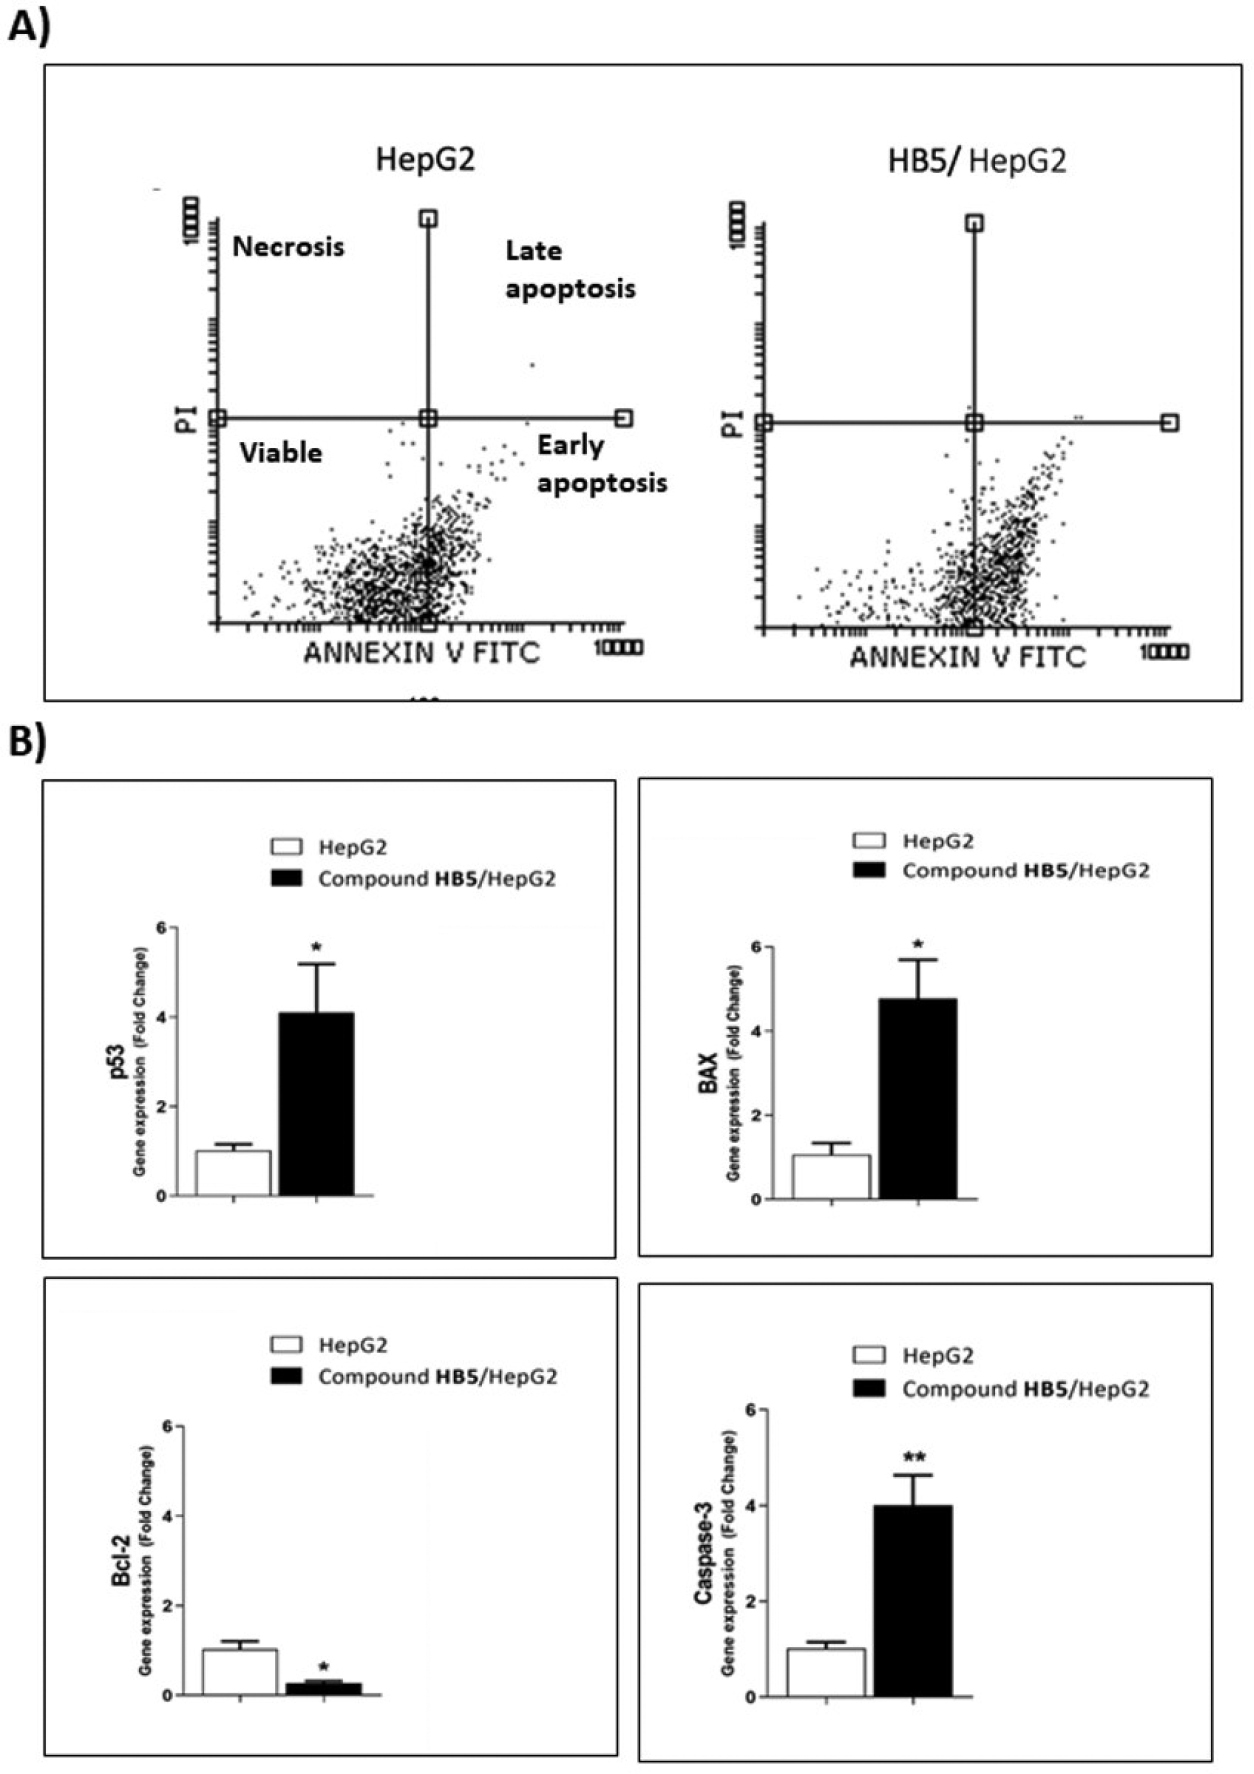
Treating Hep G2 hepatocyte carcinoma cells with compound HB5 induces apoptosis. A Representative flow cytometric charts for control and HB5-treated Hep G2 hepatocyte carcinoma cells showing the distribution of viable, apoptotic, and necrotic cells. Hep G2 cells were treated with compound HB5 (2.87 µM) for 48 h, fixed and stained with PI and fluorescent annexin V. Viable cells (bottom left; annexin V negative/PI negative), early apoptotic cells (bottom right; annexin V positive, PI negative), necrotic cells (top left; annexin V positive, PI positive), and late apoptotic cells (top right; annexin V positive, PI negative); B Total RNA was extracted from control and HB5-treated cells, reverse transcribed, and assayed for p53, BAX, Bcl-2, and caspase-3 gene expression by qRT-PCR. Data are presented as mean ± SEM of three independent experiments of the fold change in the ratio of relative mRNA levels of target gene/GAPDH (housekeeping gene). Fold change in control cells was set at 1 arbitrary unit. *p < 0.05, **p < 0.01 as compared to control cells. |