|
||
|
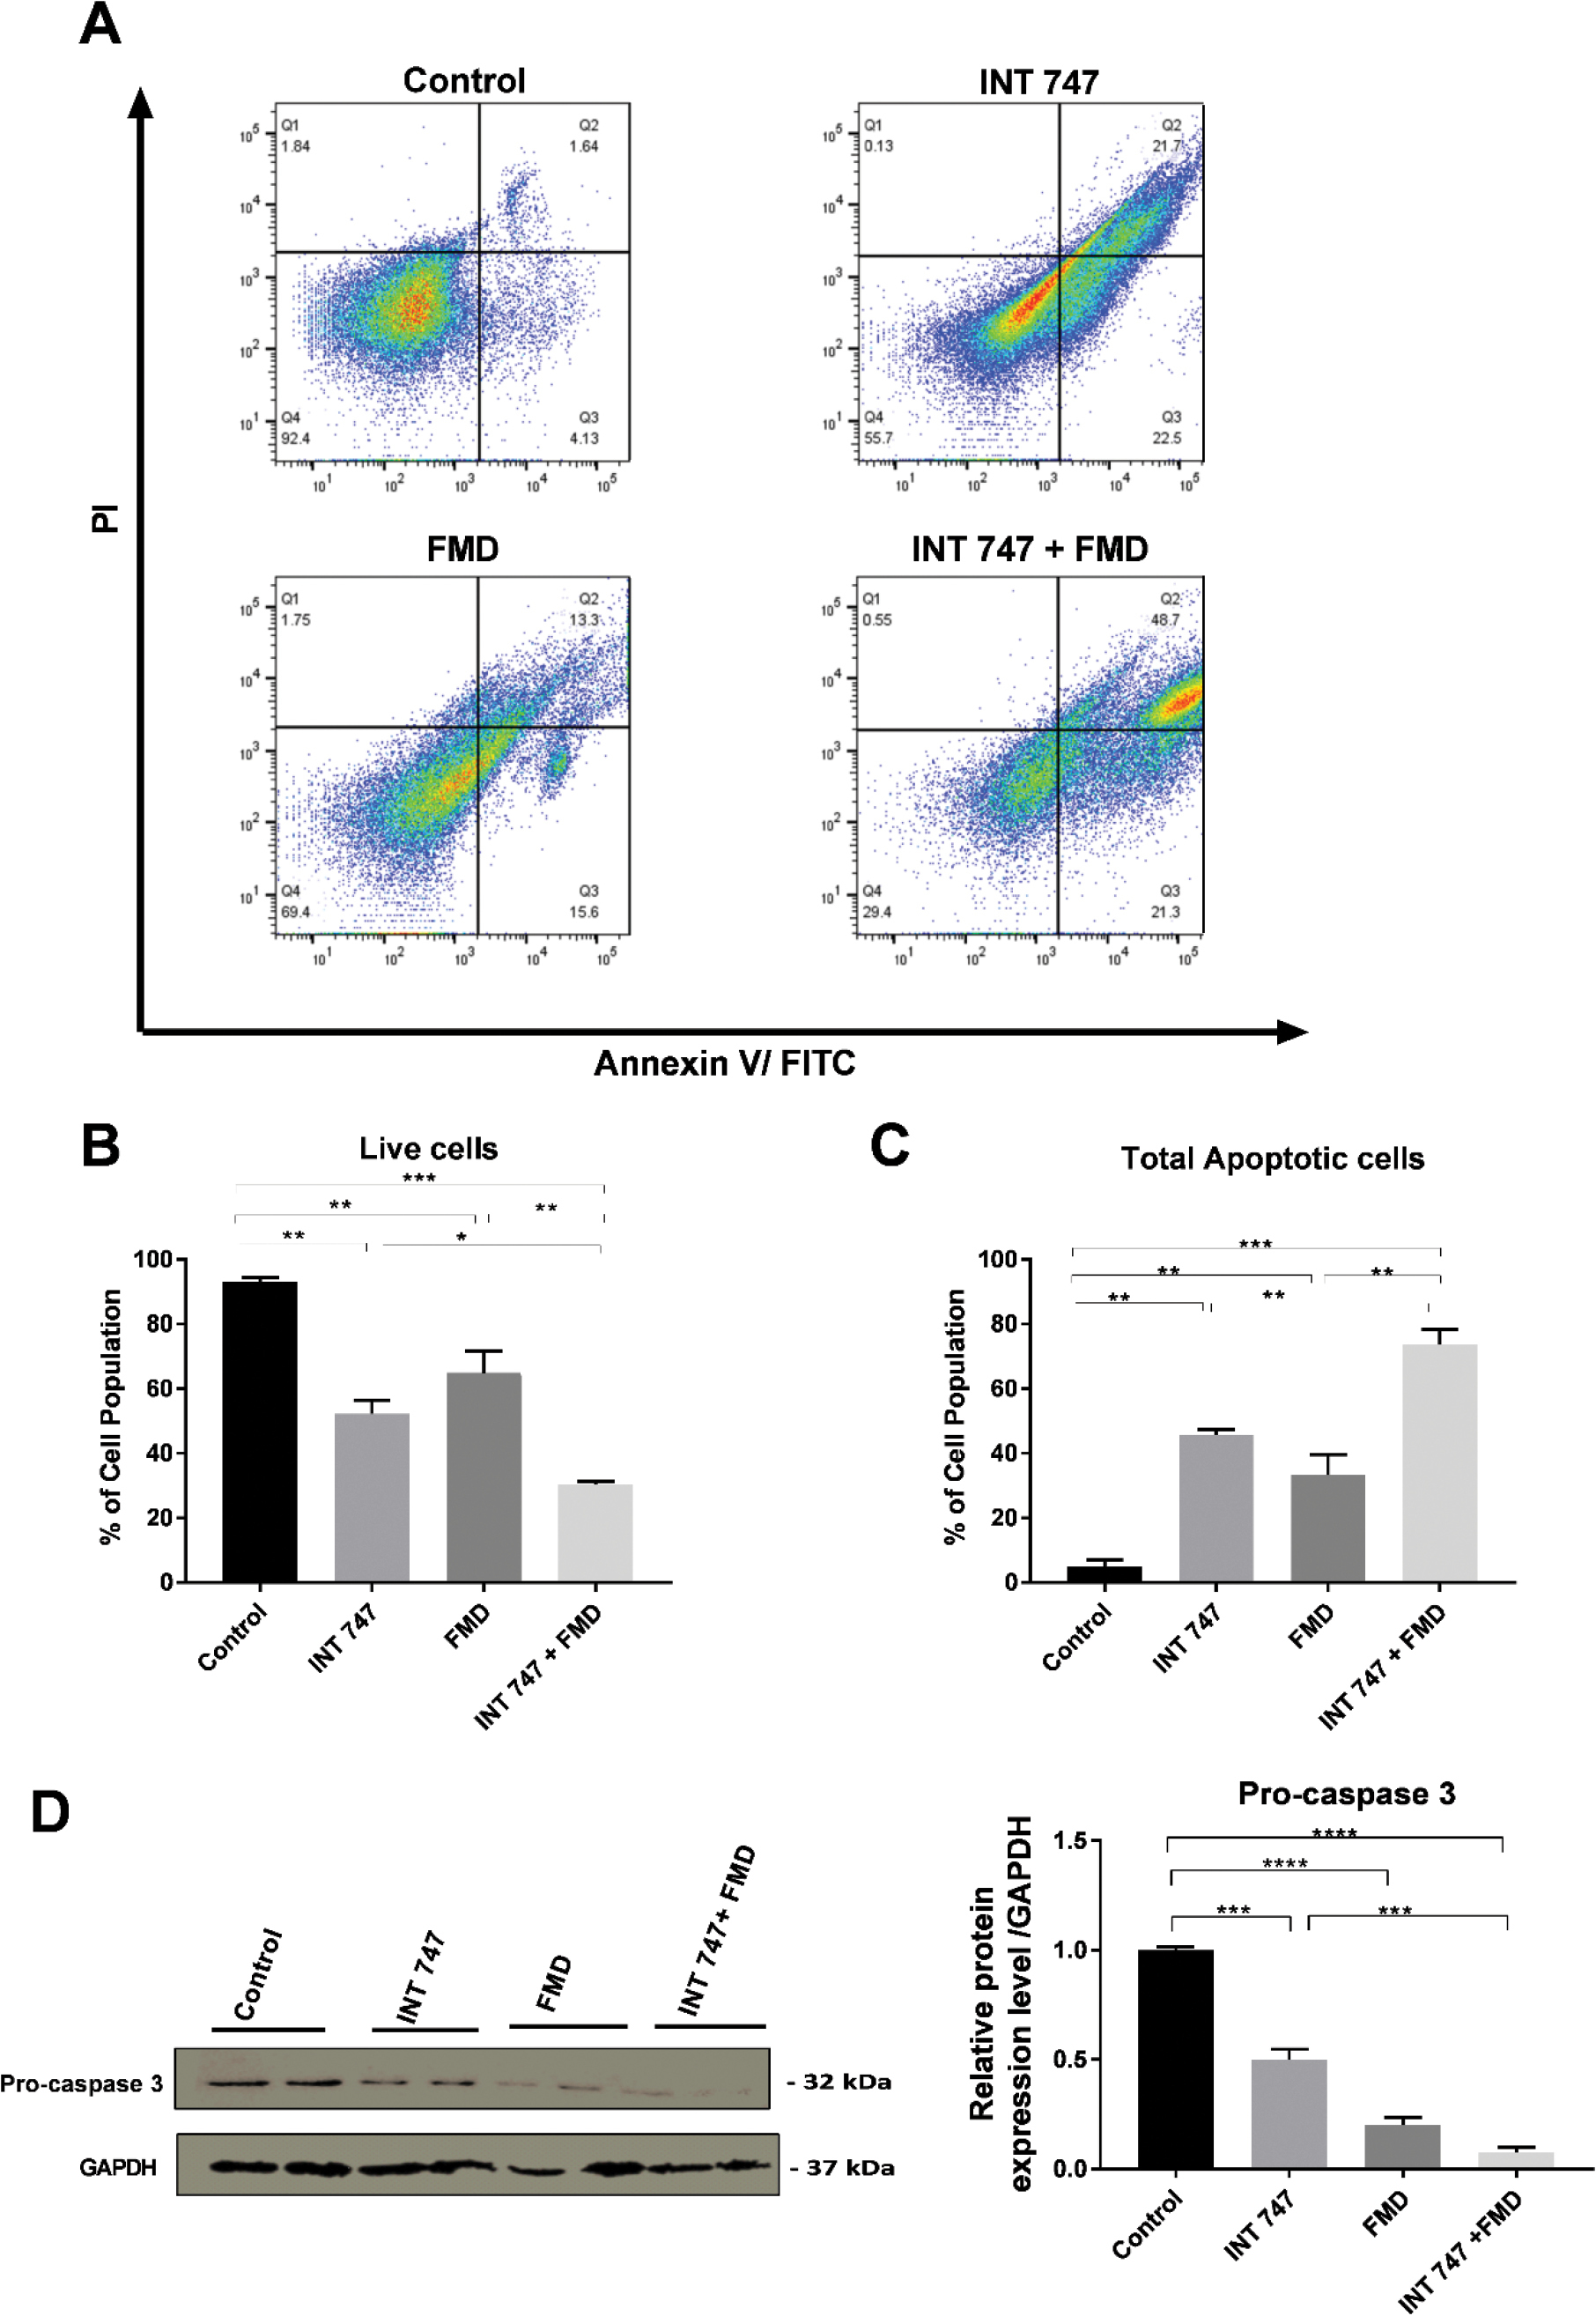
Flow cytometry analysis of PC-3 stained with annexin V and PI after 48 h of treatment with INT 747, FMD, and their combination. (A) Pseudo color dot plots represent responses to therapy with indicated compound(s) for PC-3 cells. Apoptosis was measured by annexin V-FITC/PI double staining and flow cytometry. (B) Graphical representation of live cells. (C) A graphical representation of total apoptotic cells (a sum of dead, early, and late stages) (D) expressions of pro-caspase 3 detected by Western blot. GAPDH was used as a loading control. FITC, fluorescein isothiocyanate; PI, propidium iodide. |