|
||
|
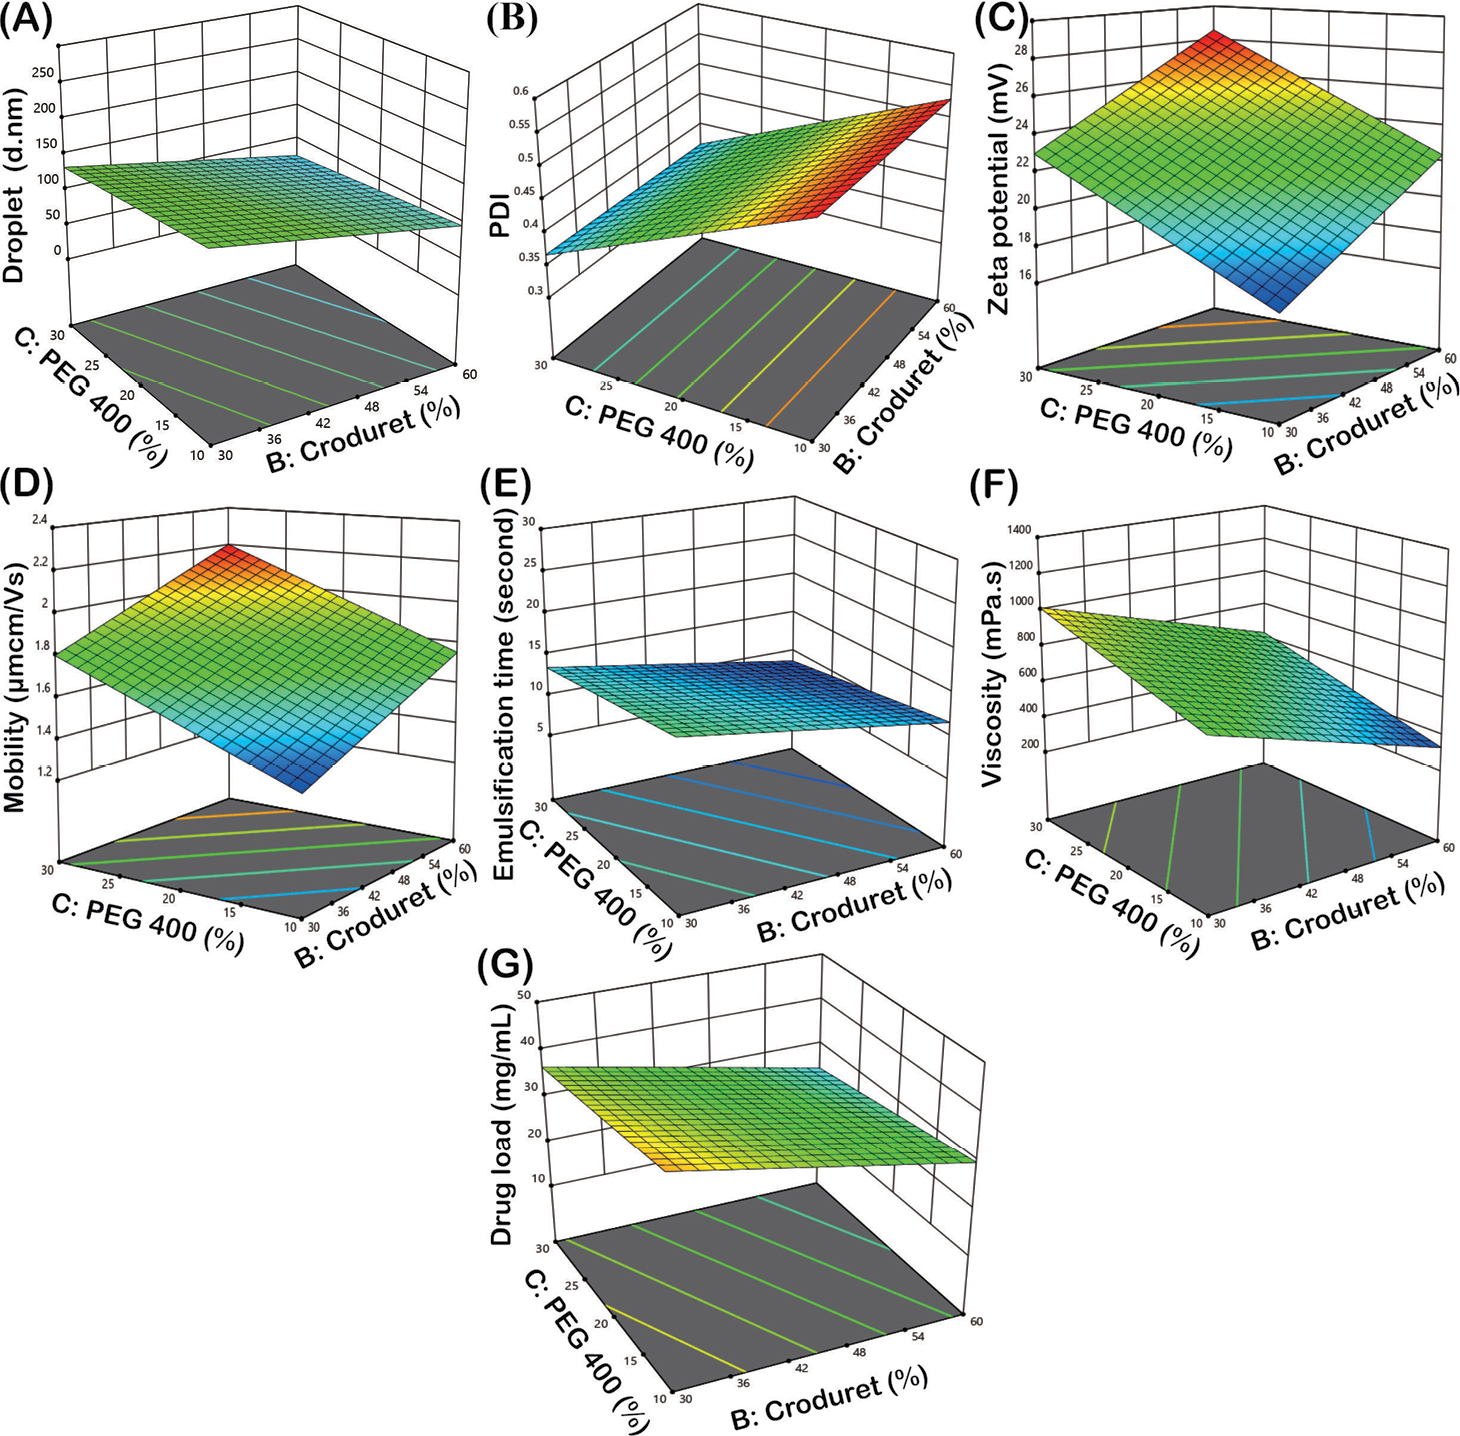
Graph of the 3D model surface plot of the evaluated responses, (A) droplet size (B) Polydispersity index, (C) zeta potential, (D) electrophoretic mobility, (E) emulsification time, (F) viscosity, (G) drug load. |
|
||||||||
| Part of: Pratiwi G, Ramadhiani AR, Shiyan S (2022) Understanding the combination of fractional factorial design and chemometrics analysis for screening super-saturable quercetin-self nano emulsifying components. Pharmacia 69(2): 273-284. https://doi.org/10.3897/pharmacia.69.e80594 |