|
||
|
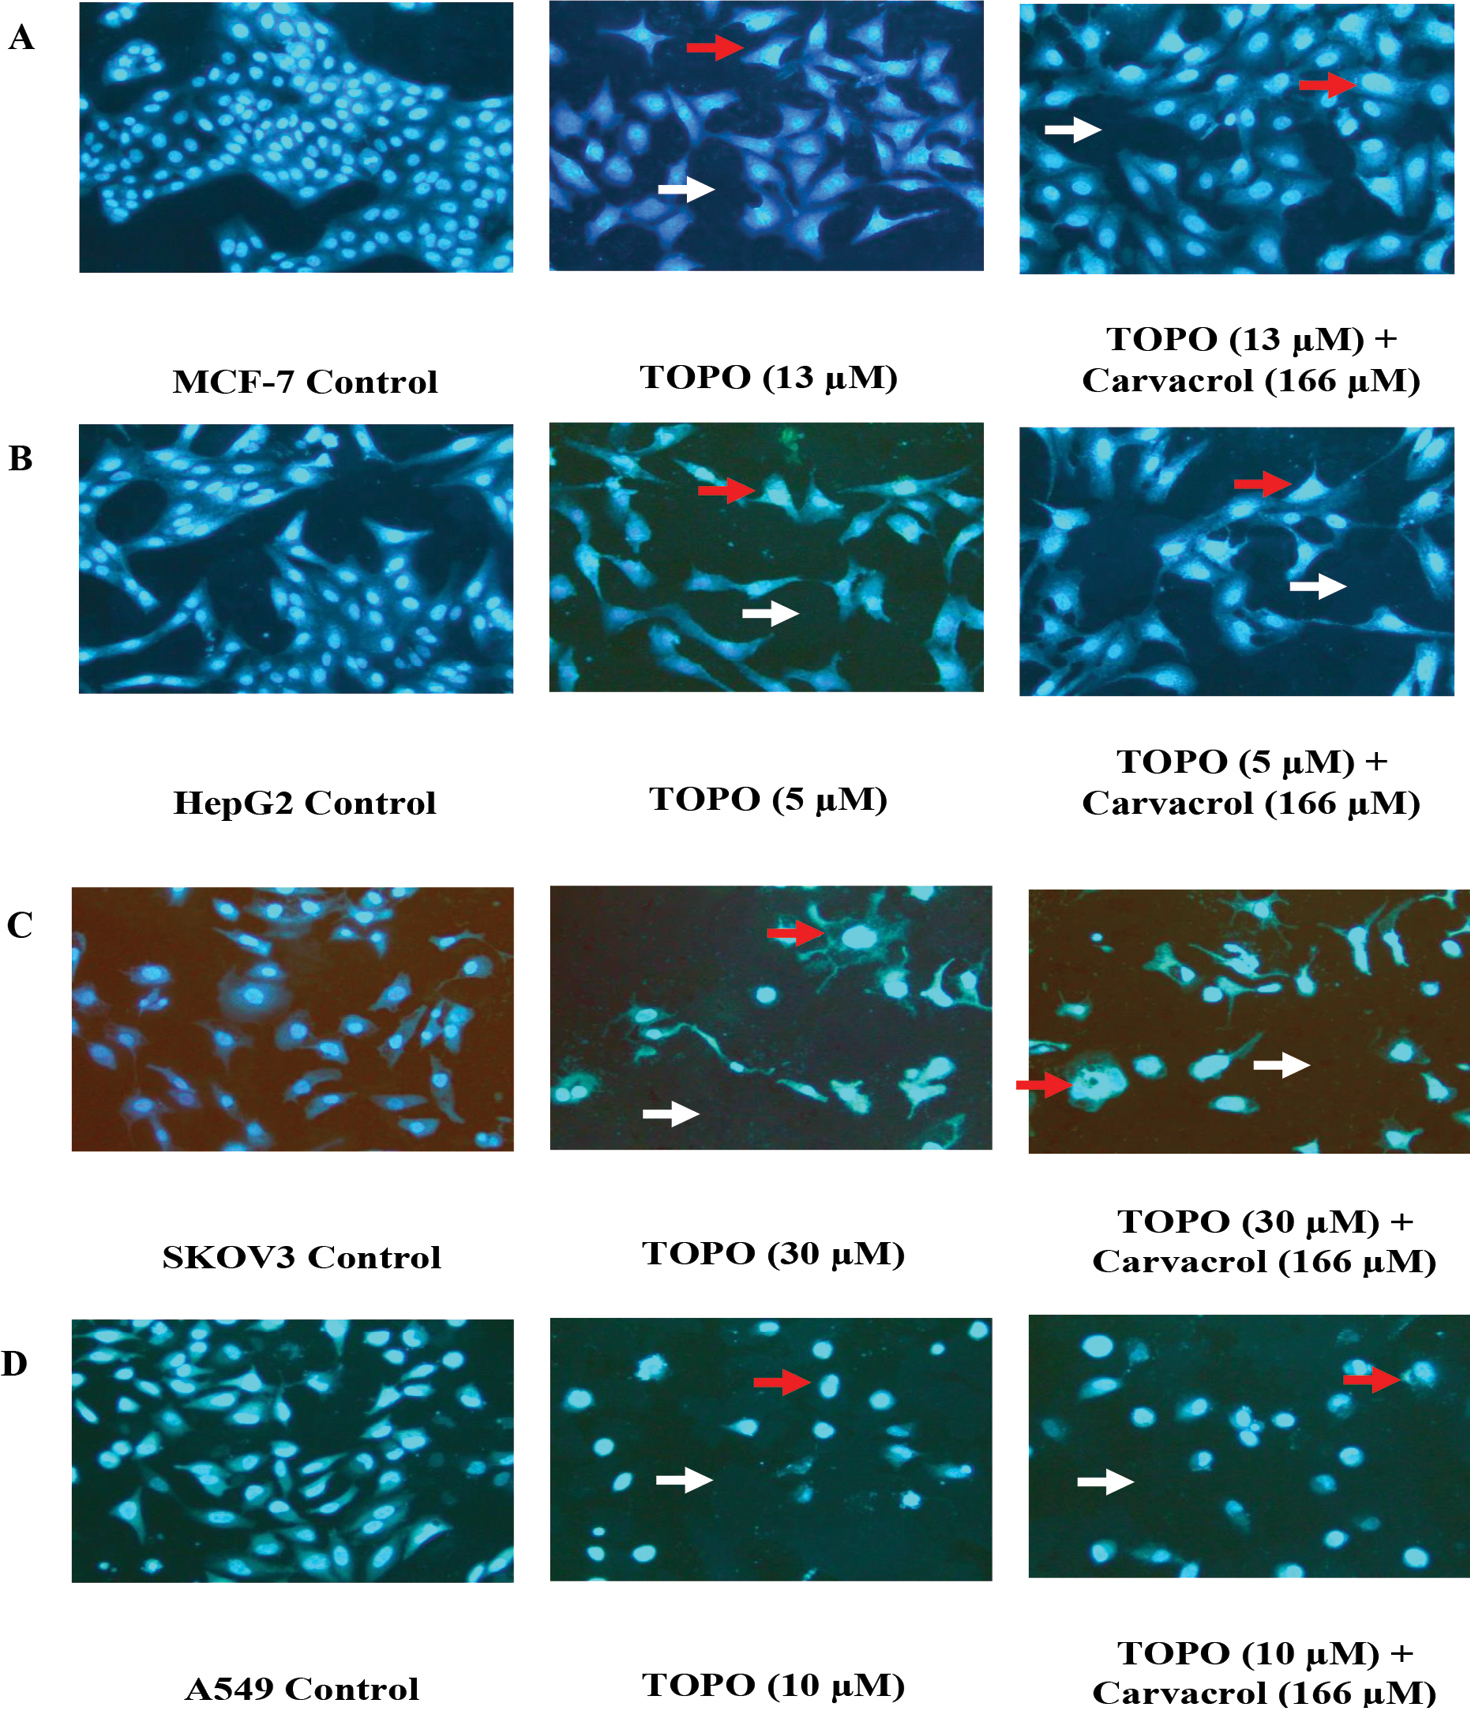
Fluorescent microscopy images (Scale bar: 20 µm) of (A) MCF-7, (B) HepG2, (C) SKOV3 and (D) A549 cell lines cell lines treated for 24 h with TOPO IC50 in the absence or presence of carvacrol (166 µM). Images were magnified at 20×. The red, and white arrows represented nuclear enlargement or irregular shape, and intercellular space increase, respectively. Images were taken from at least three independent experiments with similar conditions. |