|
||
|
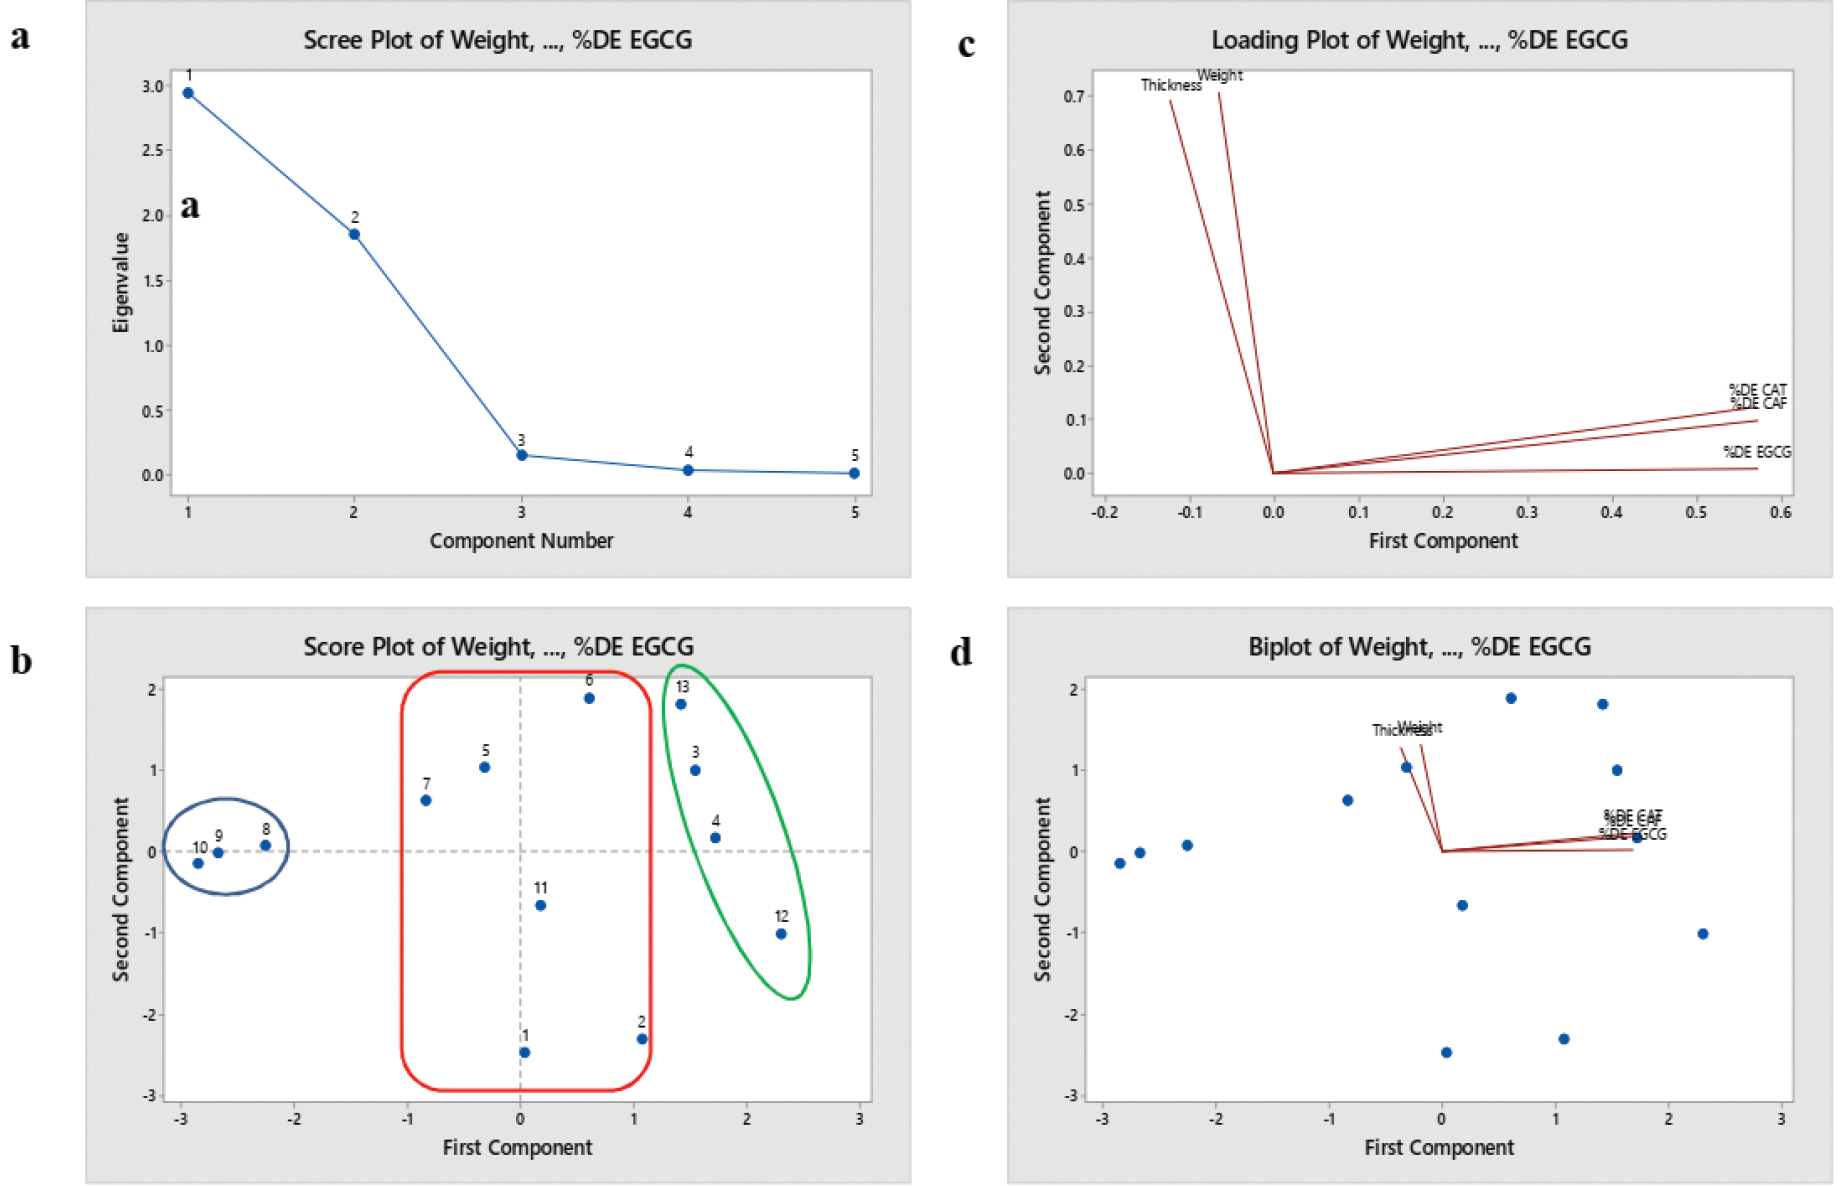
PCA scree plot illustrated the number of principal component to keep in PCA (a), PCA score plot illustrated the correlation between samples (formulas) (b), PCA loading plot illustrated the correlation between responses (c), PCA bi-plot (d). |
|
||||||||
| Part of: Setyawan EI, Rohman A, Setyowati EP, Nugroho AK (2021) The combination of simplex lattice design and chemometrics in the formulation of green tea leaves as transdermal matrix patch. Pharmacia 68(1): 275-282. https://doi.org/10.3897/pharmacia.68.e61734 |