|
||
|
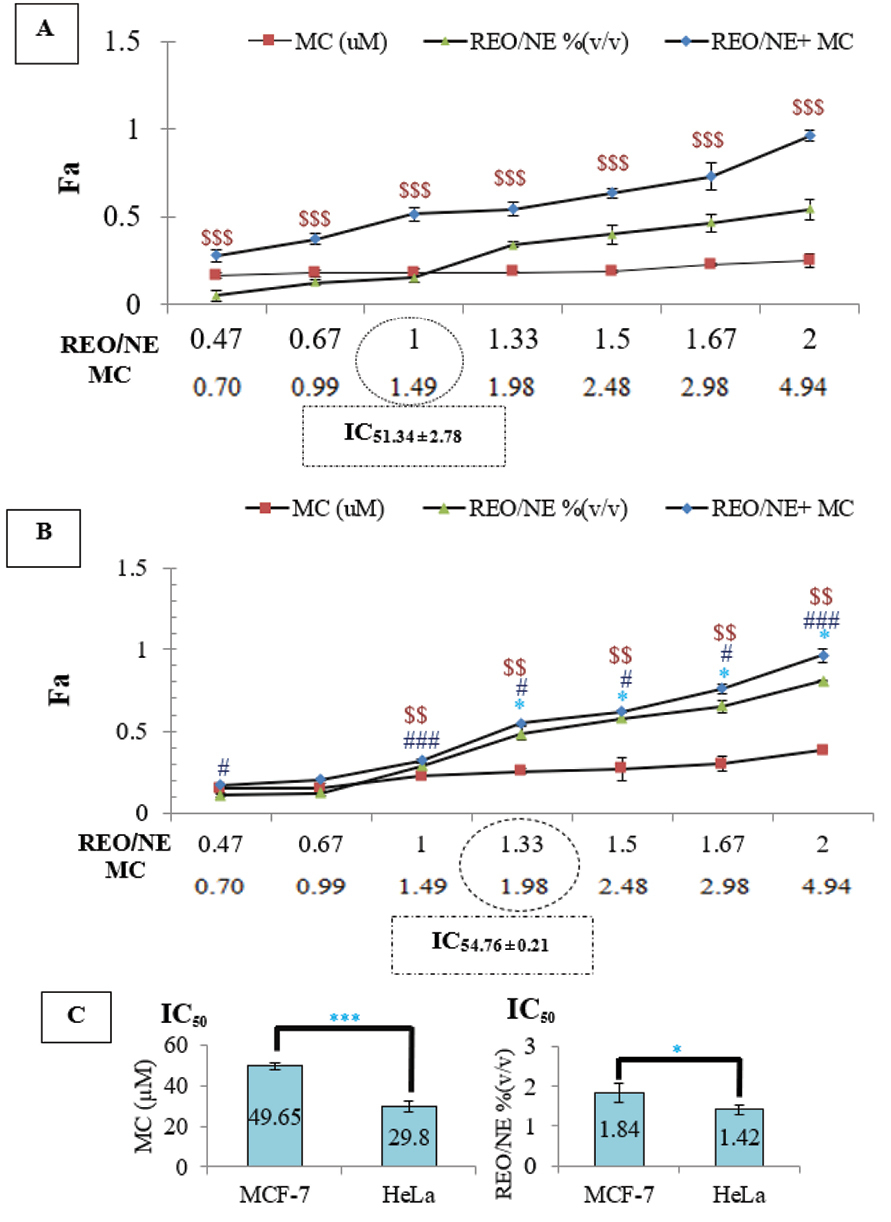
Inhibition of cell proliferation expressed as fraction affected (Fa) and assessed with MTT. Bar charts showing the Fa of (A) MCF-7 and (B) HeLa cells after 24 h of treatment with different drug concentrations. (C) IC50 of individual drug treatments. Data shown are presented as mean ±SD (n=3). The symbols # and * indicate significant differences between MCF-7 and HeLa cells. $ indicates differences between MC and REO/NE + MC; #,*p <0.05, **P <0.01, ###, $$$ P <0.001. |