|
||
|
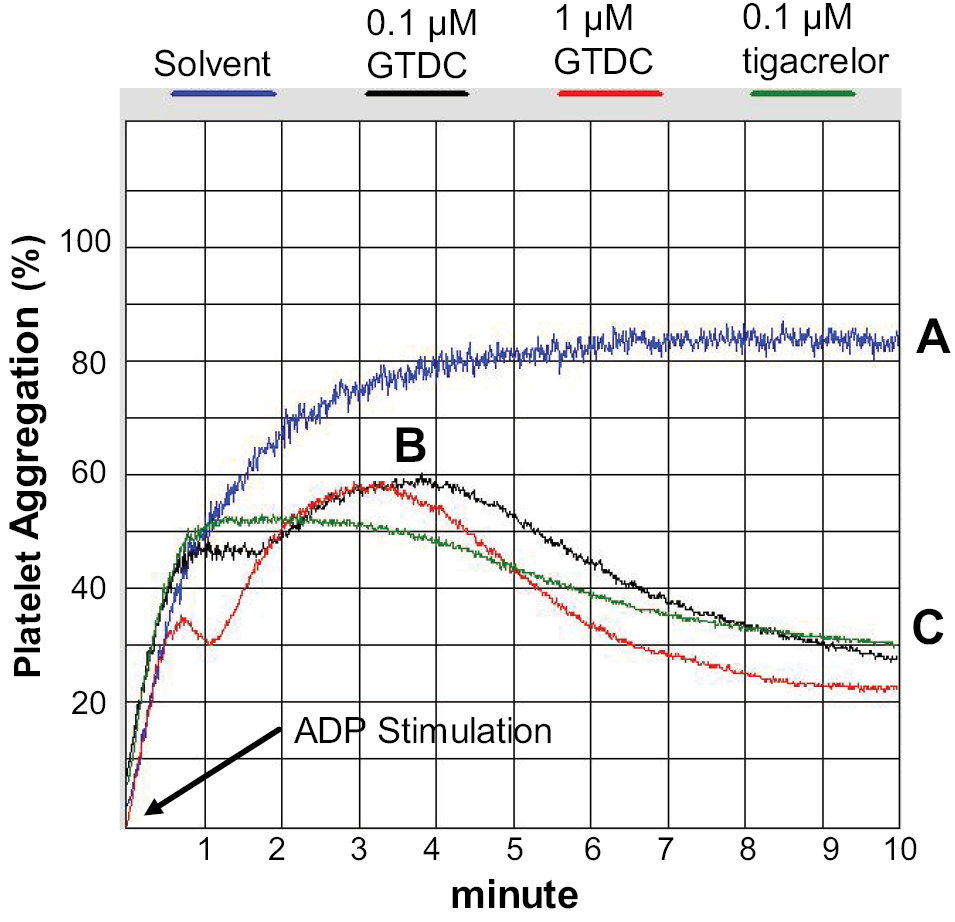
Curve showing the antiplatelet activity profiles of GTDC in ADP-induced platelet aggregation. A Baseline or peak of platelet aggregation (solvent treatment); B Peak of platelet aggregation in GTDC or ticagrelor treatments; C Platelet disaggregation in GTDC or ticagrelor treatments. Blue line, solvent; black line, 0.1 µM GTDC; red line, 1 µM GTDC; and green line, 0.1 µM tigacrelor. |