|
||
|
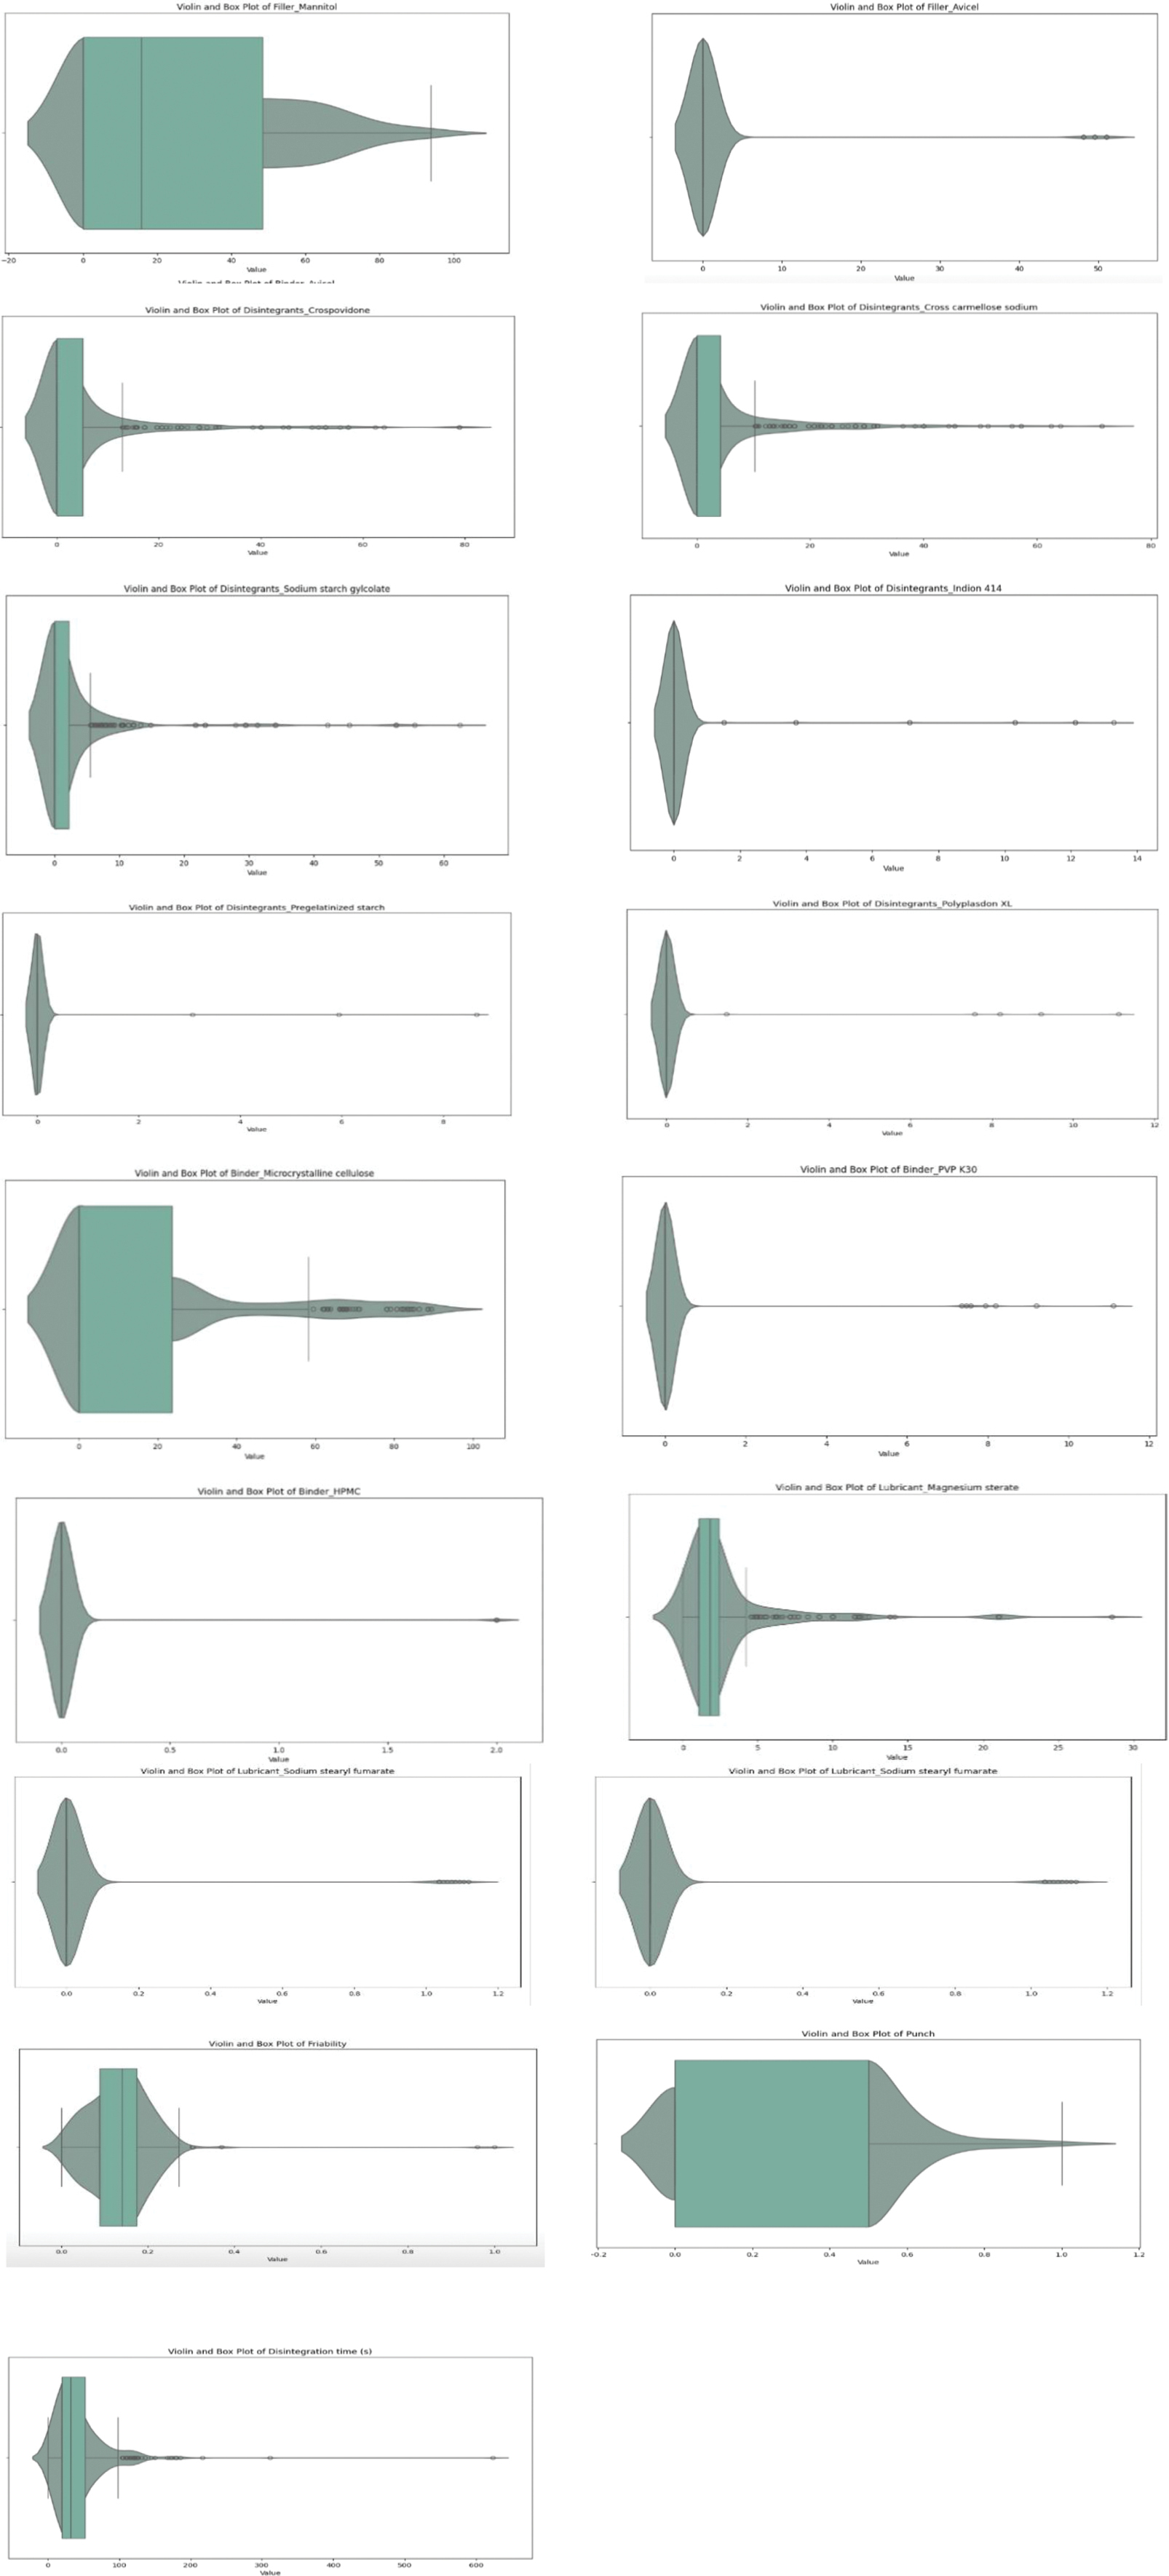
Box and violin plots of specific features from the database. The graph illustrates the interquartile range (IQR) using boxes, which include the first quartile (Q1), median (horizontal line), and third quartile (Q3). The lower whisker is calculated as Q1–1.5*IQR and the upper whisker as Q3 + 1.5*IQR. These graphs demonstrate the dispersion of numerical data through the kernel density function. |