|
||
|
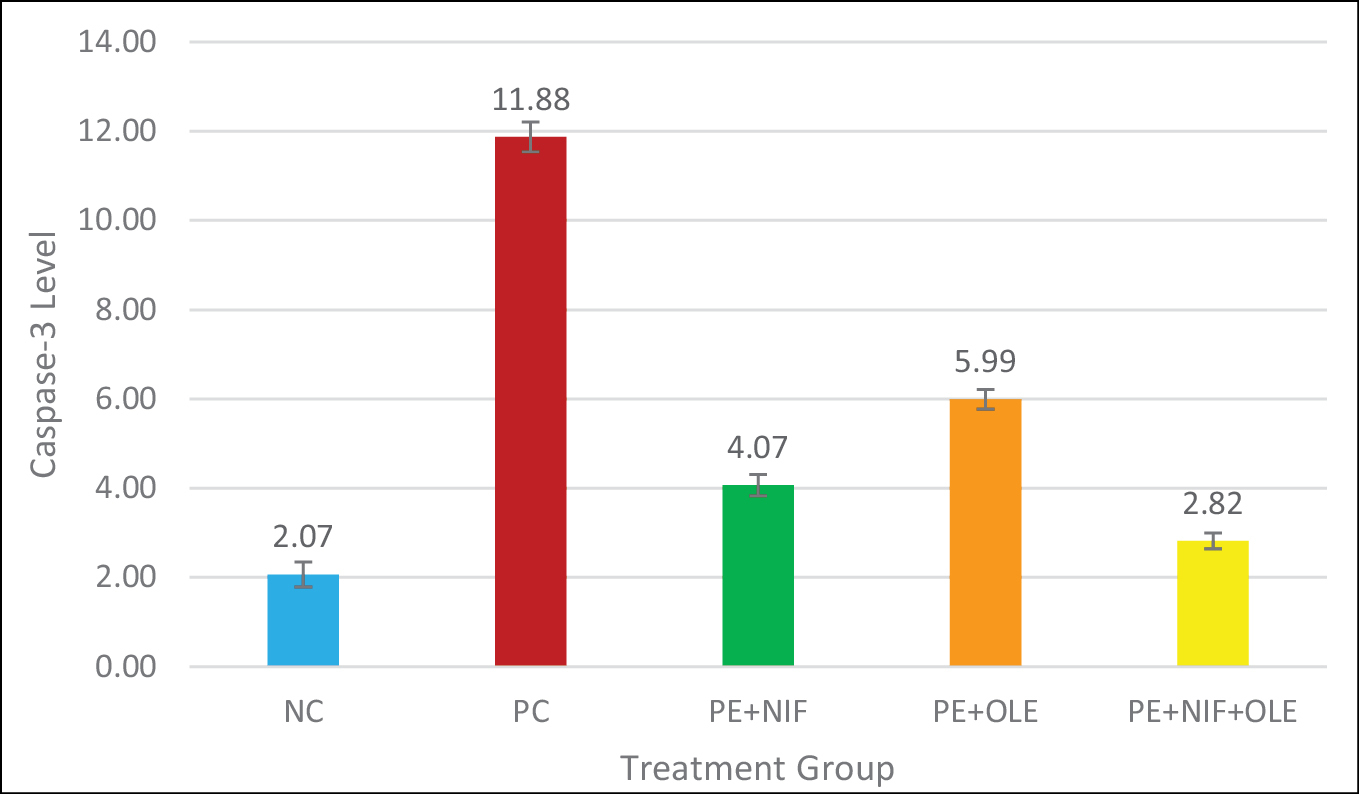
Mean Caspase 3 Levels in Different Treatment Groups. The bar graph illustrates the mean caspase 3 levels (± SD) in the normal control group (NC), positive control group (PC), pre-eclampsia group with nifedipine treatment (PE+NIF), pre-eclampsia group with olive leaf extract treatment (PE+OLE), and pre-eclampsia group with a combination of nifedipine and olive leaf extract treatment (PE+NIF+OLE). The data highlight significant differences in caspase 3 levels among the treatment groups, suggesting the potential of combined interventions in modulating apoptotic processes in pre-eclampsia. |