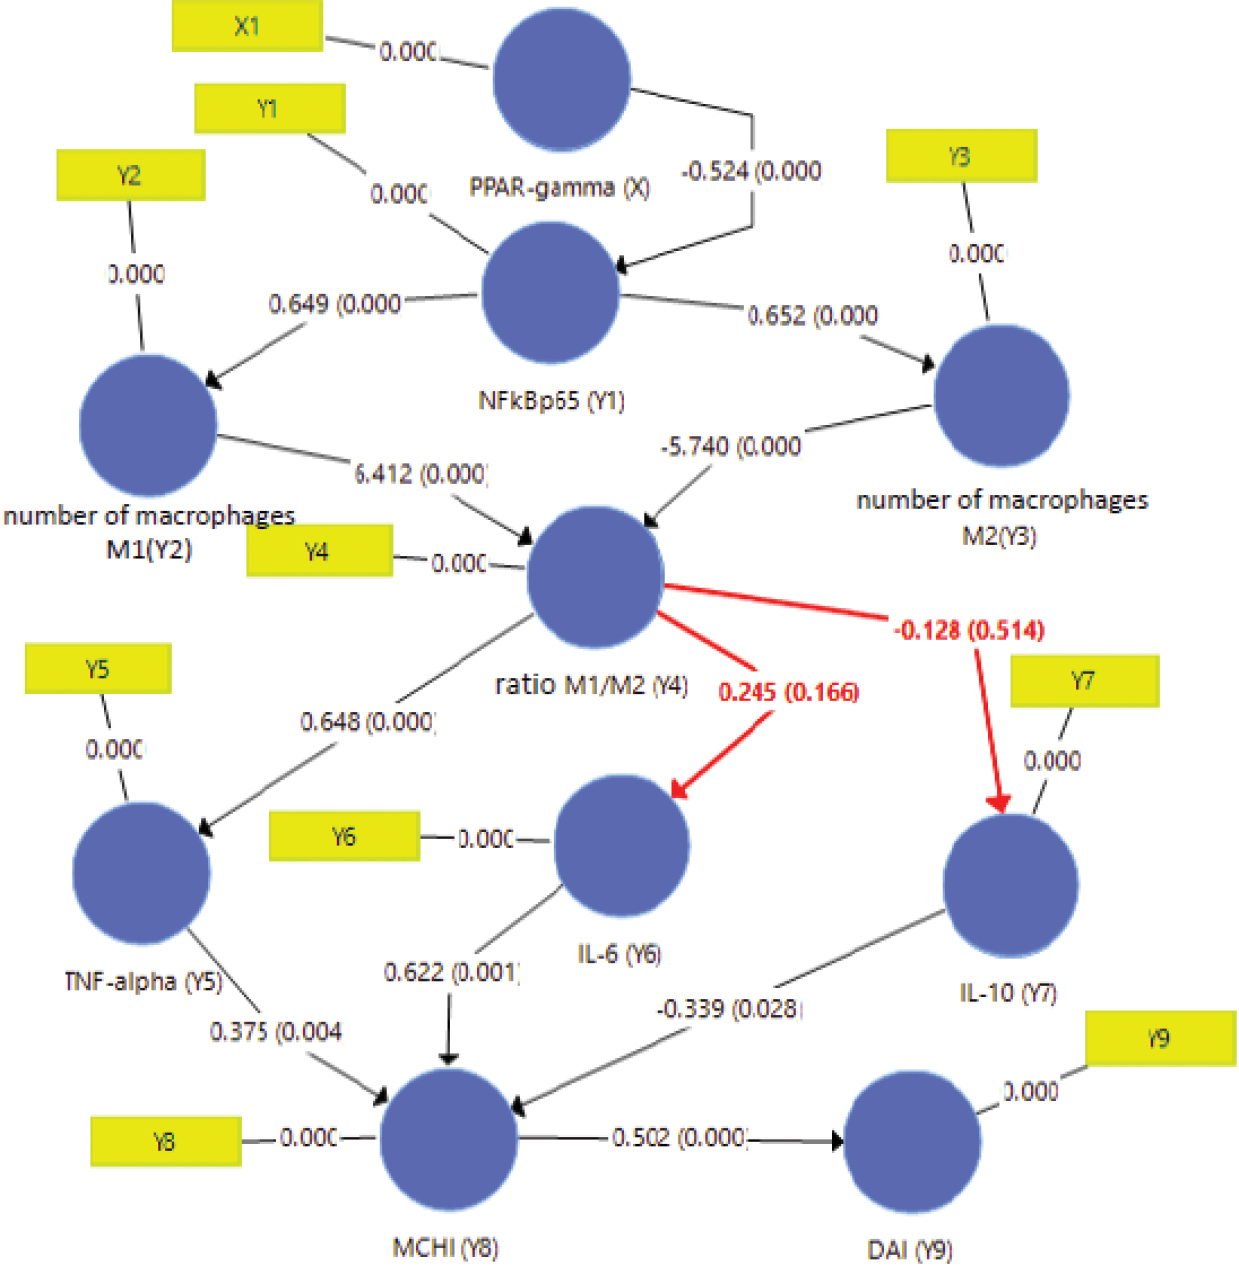
Pathway diagram in the relationship model between PPAR-γ expression (X), NF-κB p65 expression (Y1), number of M1 macrophages (Y2), number of M2 macrophages (Y3), M1/M2 macrophage ratio (Y4), TNF-α (Y5), IL-6 levels (Y6), IL-10 levels (Y7), MCHI (Y8), and DAI (Y9).


  Part of: Rika Trismayanti NM, Handono K, Handayani D, Kalsum U, Rukmigarsari E (2024) Pathway analysis of the effect of virgin coconut oil on suppressing colonic mucosal inflammation and clinical symptoms in ulcerative colitis. Pharmacia 71: 1-7. https://doi.org/10.3897/pharmacia.71.e121674