|
||
|
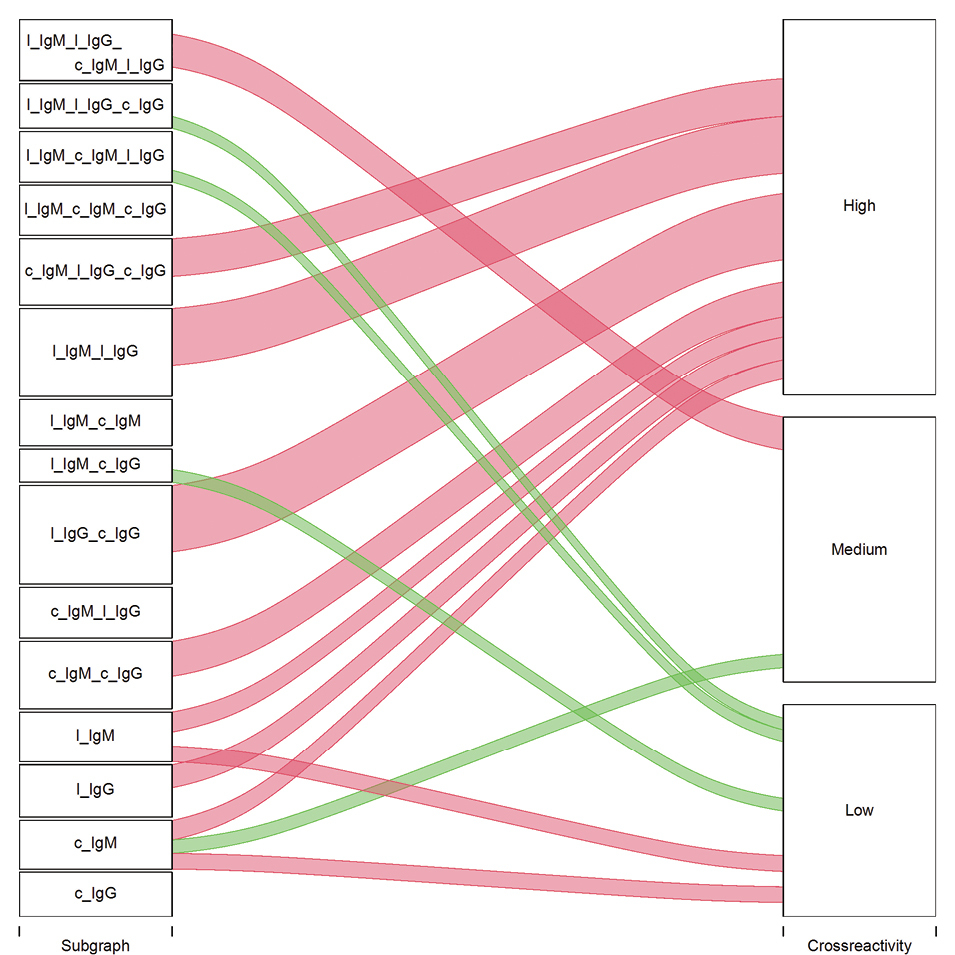
Graph overlaps. The four T/I graphs and their various combinations had their edge weights categorized as low – [2, 2.3), medium – [2.3, 2.6) and, high – >2.6 indicating the respective levels of cross-reactivity (pattern similarity). The sums of the edge weights which were outside the 0.05–0.95 quantile range of the simulate distribution are illustrated. The thickness of the connecting strips corresponds to the sums of weights of the overlapping edges. For some of the graphs the number of overlapping edges is significantly increased (red) or decreased (green) relative to the simulated randomly connected graphs. The distribution is drawn towards high overlap among multiple subgraphs which indicates a considerable consensus between the different conditions including between arrays of peptides in linear vs cyclic topology. |