|
||
|
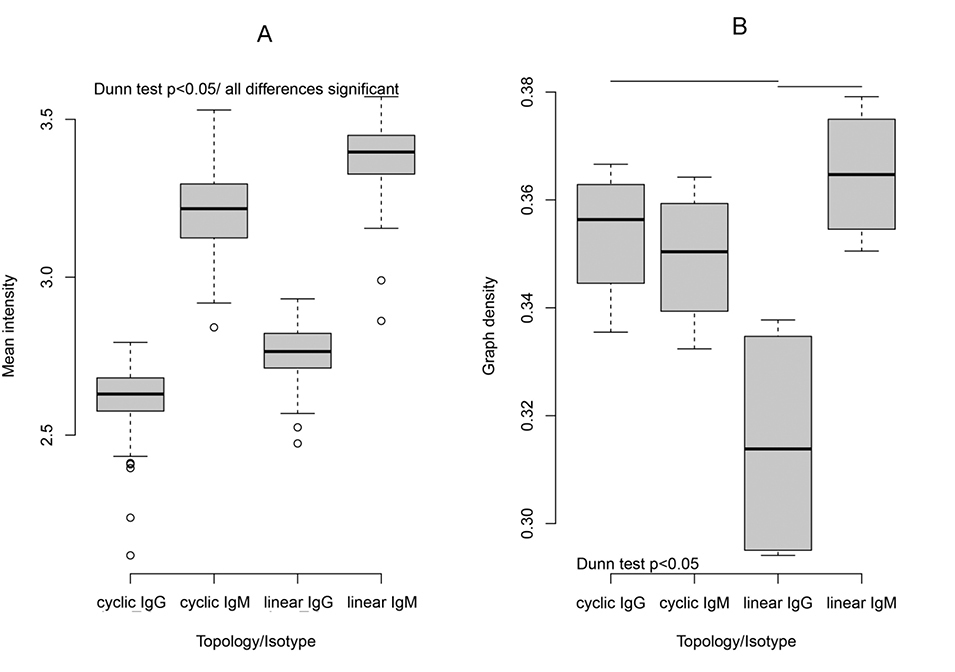
A. Mean intensity of the binding data for the graphs grouped by the topology of the peptides (cyclic or linear) and by the isotype of the tested antibodies; B. Graph density of graphs grouped by the topology and isotype. The graph density is the ratio of the number of edges to the theoretical maximum for each graph. Among the graphs of the data based on linear peptides and tested with patients IgG showed lower density while those tested with IgM – higher than the cyclic peptide graphs. This is interpreted as lower, resp.: higher, cross-reactivity. |