|
||
|
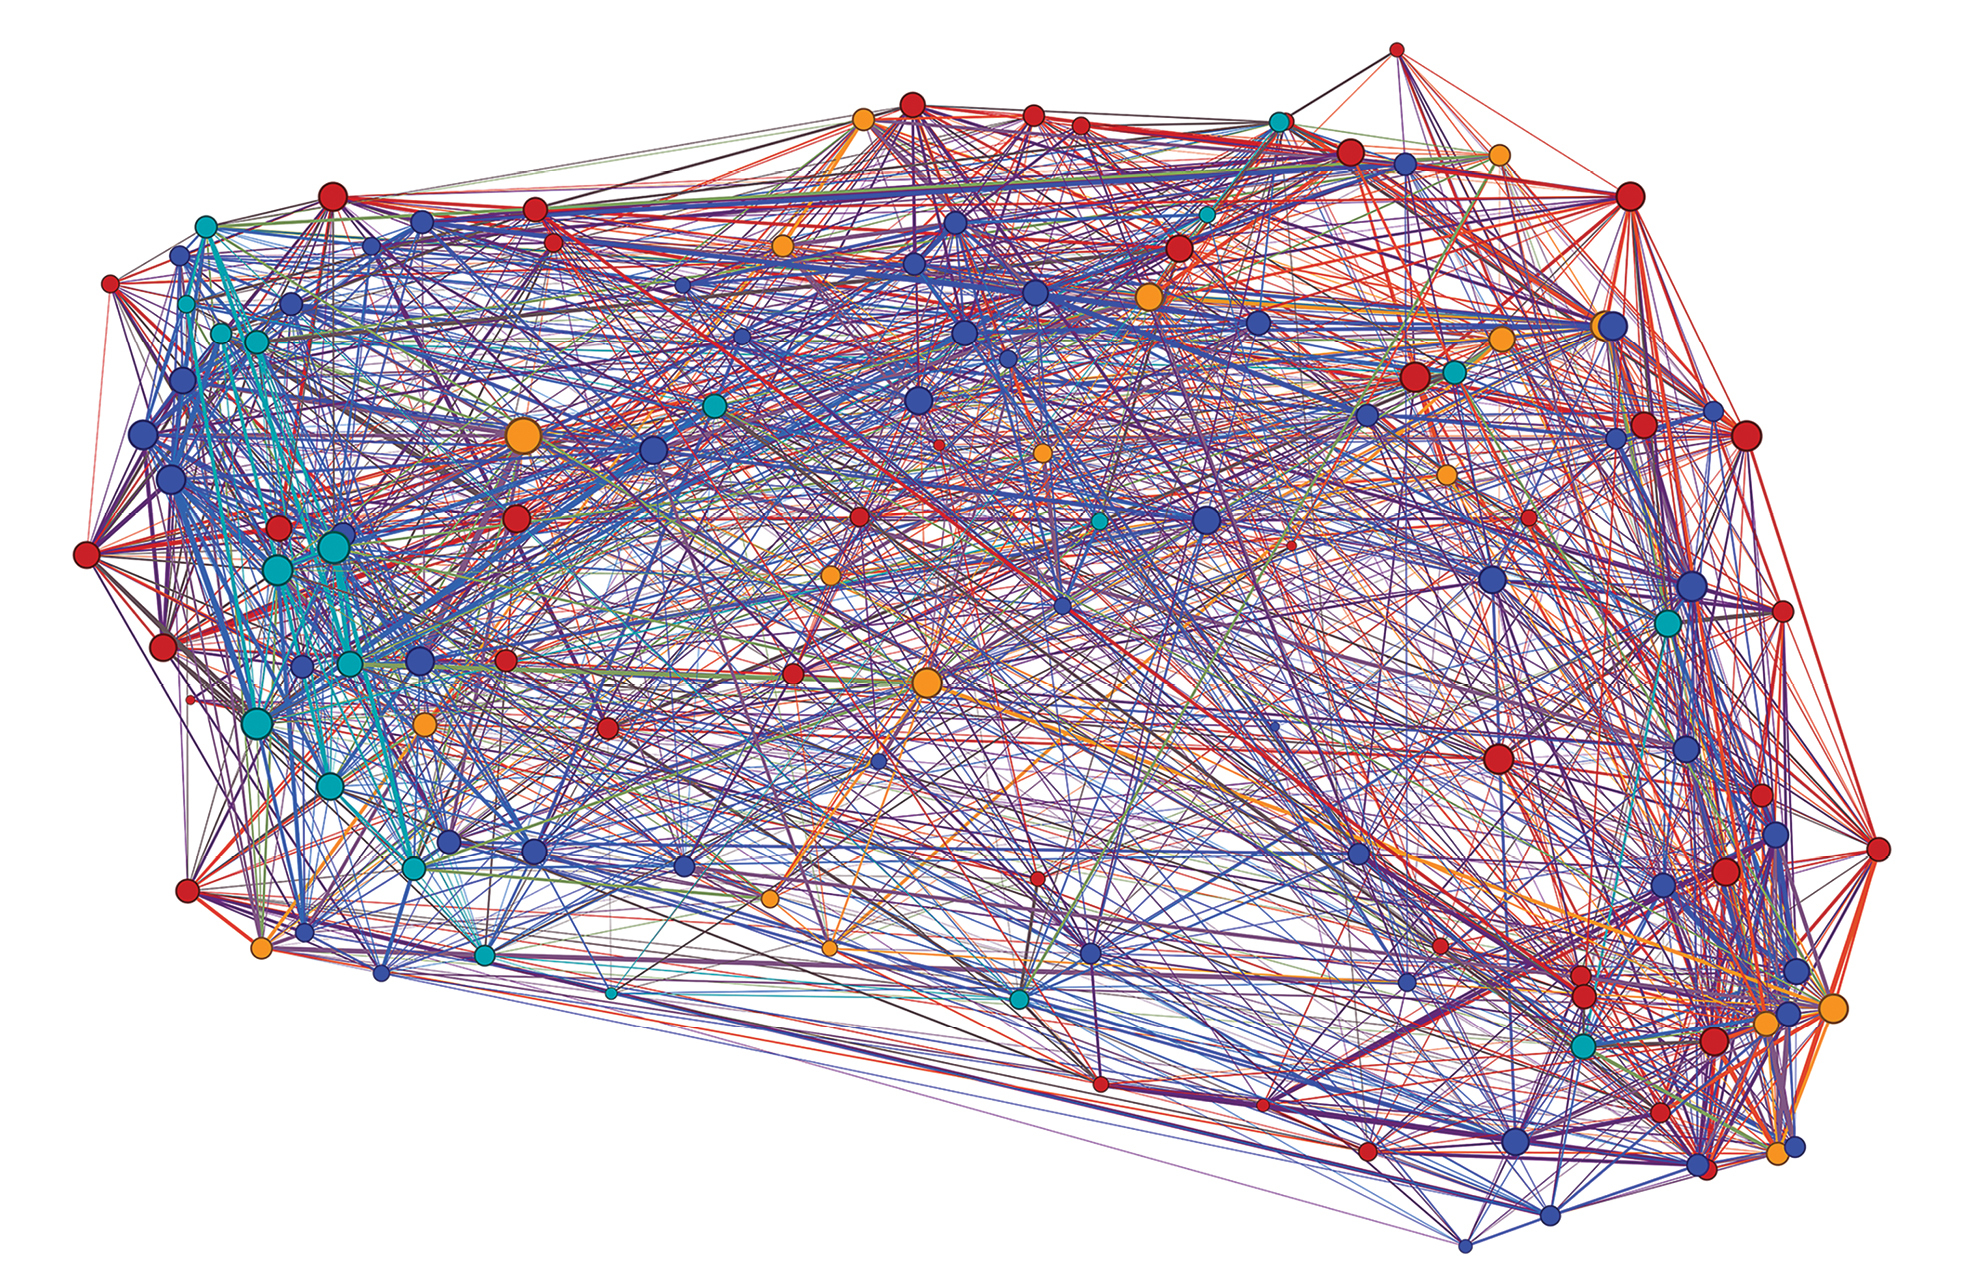
Overview of the general reactivity graph constructed as the union of the reactivity graphs under different conditions (IgG or IgM binding; cyclic or linear peptides; AD, FTD, DUE and Control – altogether 16 different graphs based on the same vertices). The edge weights of the separate original graphs were summed. To outline only the strongest similarities, the edges were kept if their weight exceeded 17.4 (range 2–36). The vertices (peptide sequences) are color coded according to the source mimotope library (red – over expressed in AD, orange – under expressed in AD, dark blue – over expressed in FTD, light blue – under expressed in FTD). The color of the edges is a mixture of the colors of their incident vertices. The thickness of the edges is proportional to their weight interpreted as strength of cross-reactivity. The layout of the graph is an embedding based on the the 16 eigenvectors corresponding to the lowest non zero eigenvalues further projected to 2 dimensions using the UMAP algorithm. The modularity of the graph with respect to the partition by mimotope libraries equaled the 0.949 quantile of the bootstrapped modularity. When the modularity was bootstrapped dichotomously for each library against the rest, the quantiles were: 0.969 for AD high, 0.861 for FTD low, 0.647 for AD low and 0.626 for FTD high. |