|
||
|
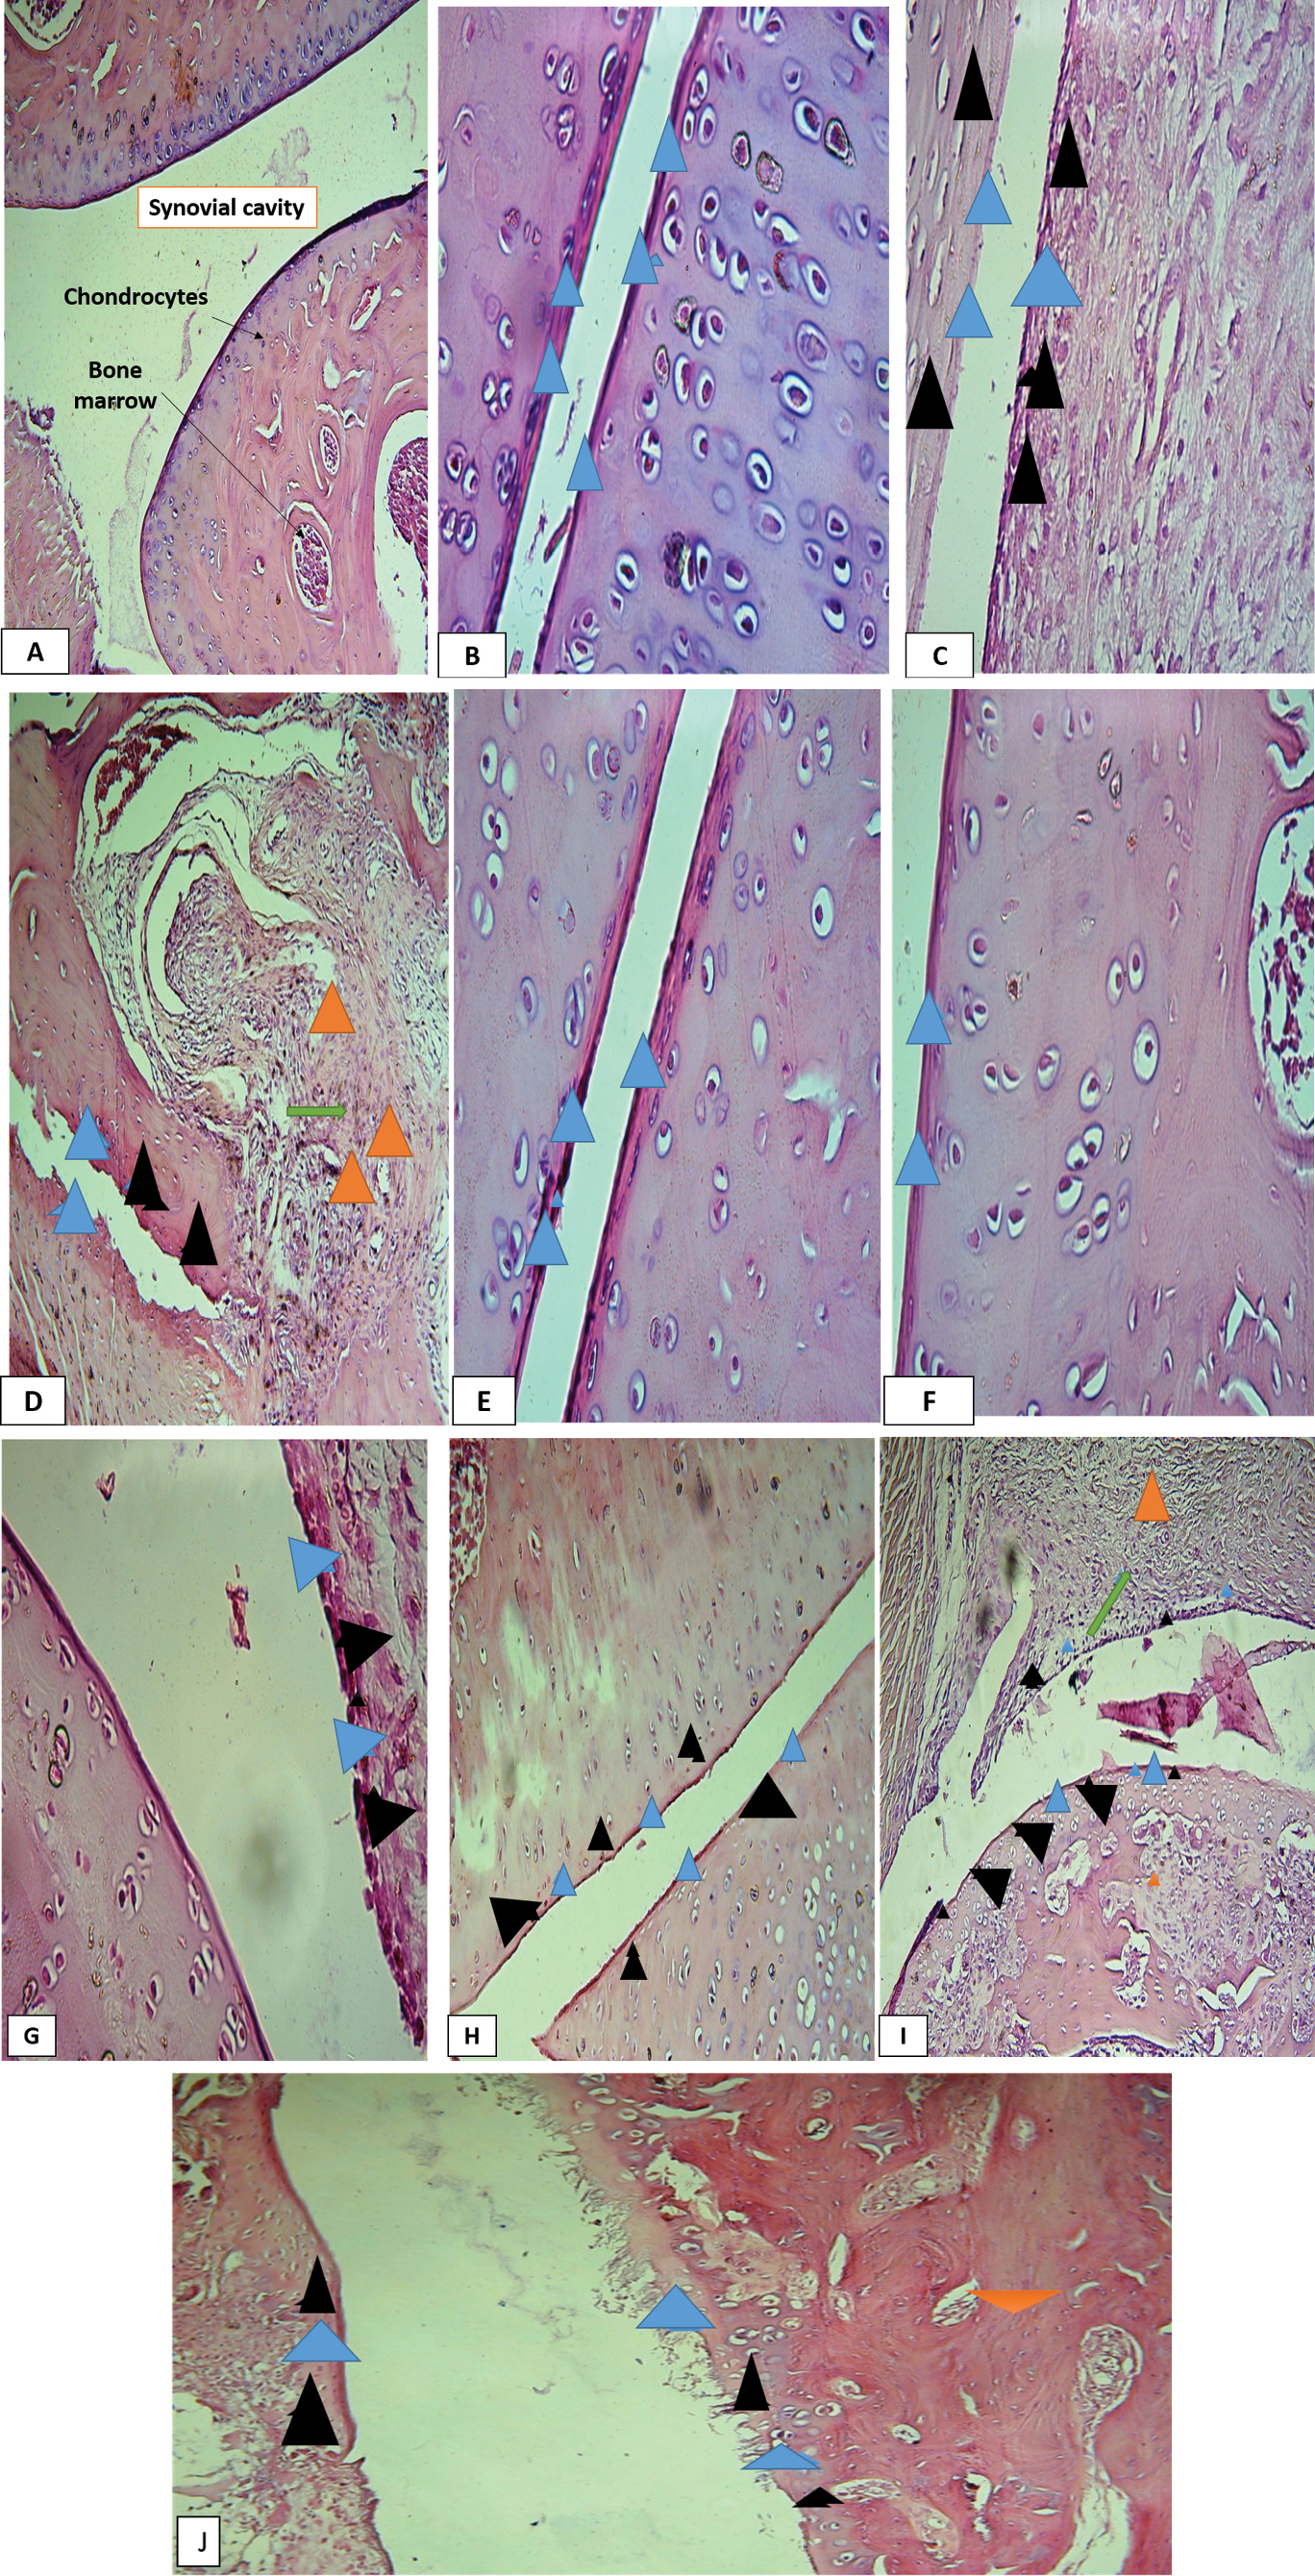
Photomicrograph of histological section from rats left knee joints stained with H&E for control Group (A); OA Group at Day 4 (B); OA Group at Day 10 (C); OA Group at Day 21 (D); Oral Treatment Group at Day 4 (E); Oral Treatment Group at Day 10 (F); Oral Treatment Group at Day 21 (G); Transdermal Treatment Group at Day 4 (H); Transdermal Treatment Group at Day 10 (I); Transdermal Treatment Group OA Group at Day 21(J). Blue triangles indicate hypertrophy, black triangles indicate hyperplasia, orange triangles indicate inflammation and green arrows indicate blood vessel formation. |